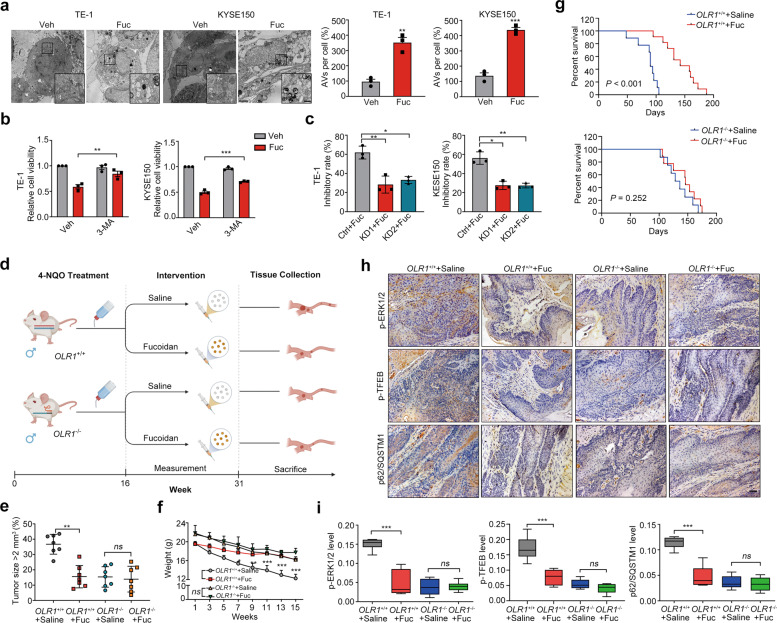
Fig. 7. Mitigation of esophageal tumorigenesis by blockade of LOX-1 with fucoidan.
a TEM analysis of cells treated with fucoidan (200 µg/mL) for 48 h (Scale bar, 2 µm; magnification, 500 nm) (Student’s t-test). b Cell viability of cells treated with fucoidan (200 µg/mL) in the presence of 3-MA (200 µM) for 48 h was measured by using the CCK-8 assay (Student’s t-test). c Cells transfected with LOX-1 siRNA (KD1/KD2) or negative control (Ctrl) were treated with fucoidan (200 µg/mL) for 48 h, and cell viability was measured by using the CCK-8 assay (Student’s t-test). d Experiment schematic of 4-NQO-induced genetic mice following treated with saline or fucoidan (Fuc) interference. e The tumor sizes of 4-NQO-induced wild-type mice and OLR1−/− mice treated with saline or Fuc (n = 7, two-way ANOVA). f The body weight of 4-NQO-induced genetic mice treated with saline or fucoidan (n = 7, two-way ANOVA). g Kaplan–Meier survival analysis of overall survival in 4-NQO-induced wild-type mice and OLR1−/− mice treated with saline or Fuc (Log-rank test). h, i Esophageal tumor tissues from 4-NQO-induced wild-type mice and OLR1−/− mice treated with saline or Fuc were conducted with IHC staining of p-ERK1/2, p-TFEB, and p62 (Scale bars, 50 µm), and the representative images and statistical analysis are shown (n = 7, student’s t-test). *P < 0.05, **P < 0.01, ***P < 0.001, ns not significant.

