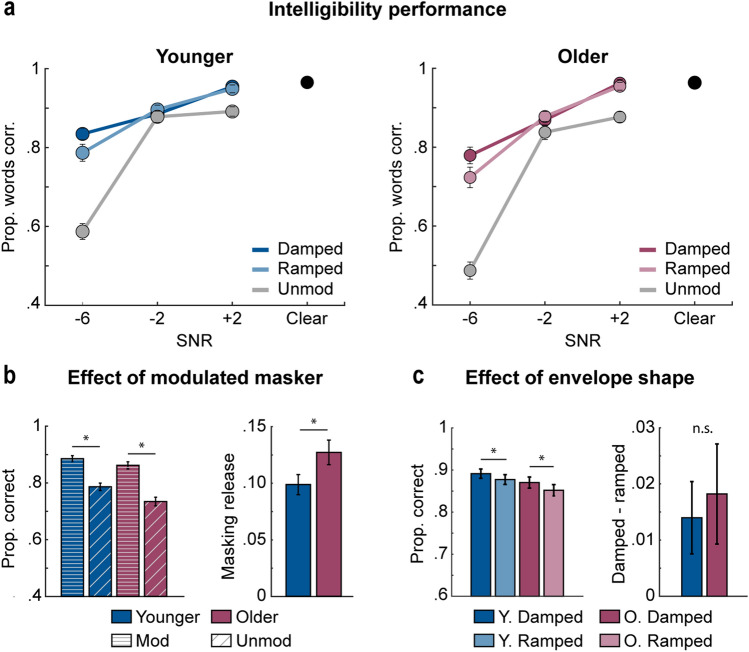
Figure 4.
Intelligibility results for Experiment 2. (a) Mean proportion of correctly reported words are plotted as a function of SNR (− 6, − 2, + 2 dB, Clear [black dot]) for the different envelope conditions (damped, ramped, unmodulated) and for younger (left) and older adults (right). (b) Mean word report (left) is plotted for the different modulation types (modulated, unmodulated) and age groups (younger, older). The difference in performance between modulated and unmodulated maskers (masking release) is plotted for both age groups (right). Plots for modulated maskers reflect the mean across damped and ramped envelope shapes. (c) Mean word report (left) is plotted for the different masker envelope shapes (damped, ramped) and age groups (younger, older). The difference in performance between the damped and ramped envelope shapes is plotted for both age groups (right). Error bars reflect the standard error of the mean. *p < 0.05.

