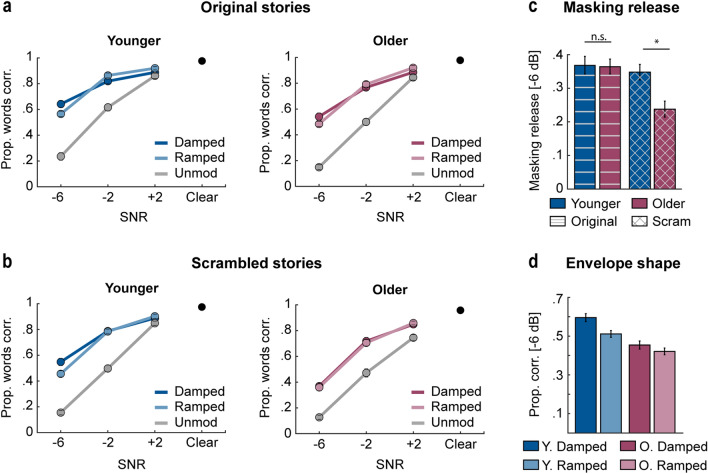
Figure 6.
Intelligibility results for Experiment 3. (a) Mean proportion of correctly reported words for original stories is plotted as a function of SNR (– 6, − 2, + 2 dB, Clear [black dot]) for the different envelope conditions (damped, ramped, unmodulated) and for younger (left) and older adults (right). (b) Mean performance for scrambled stories is plotted as a function of SNR (− 6, − 2, + 2 dB, Clear [black dot]) for the different envelope conditions (damped, ramped, unmodulated) and for younger (left) and older adults (right). (c) Mean difference in intelligibility between modulated and unmodulated maskers (masking release) at − 6 dB SNR is plotted for each story type (original, scrambled) and age group (younger, older). (d) Mean performance at − 6 dB SNR is plotted for the different masker envelope shapes (damped, ramped) and age groups. Error bars reflect the standard error of the mean. *p < 0.05.

