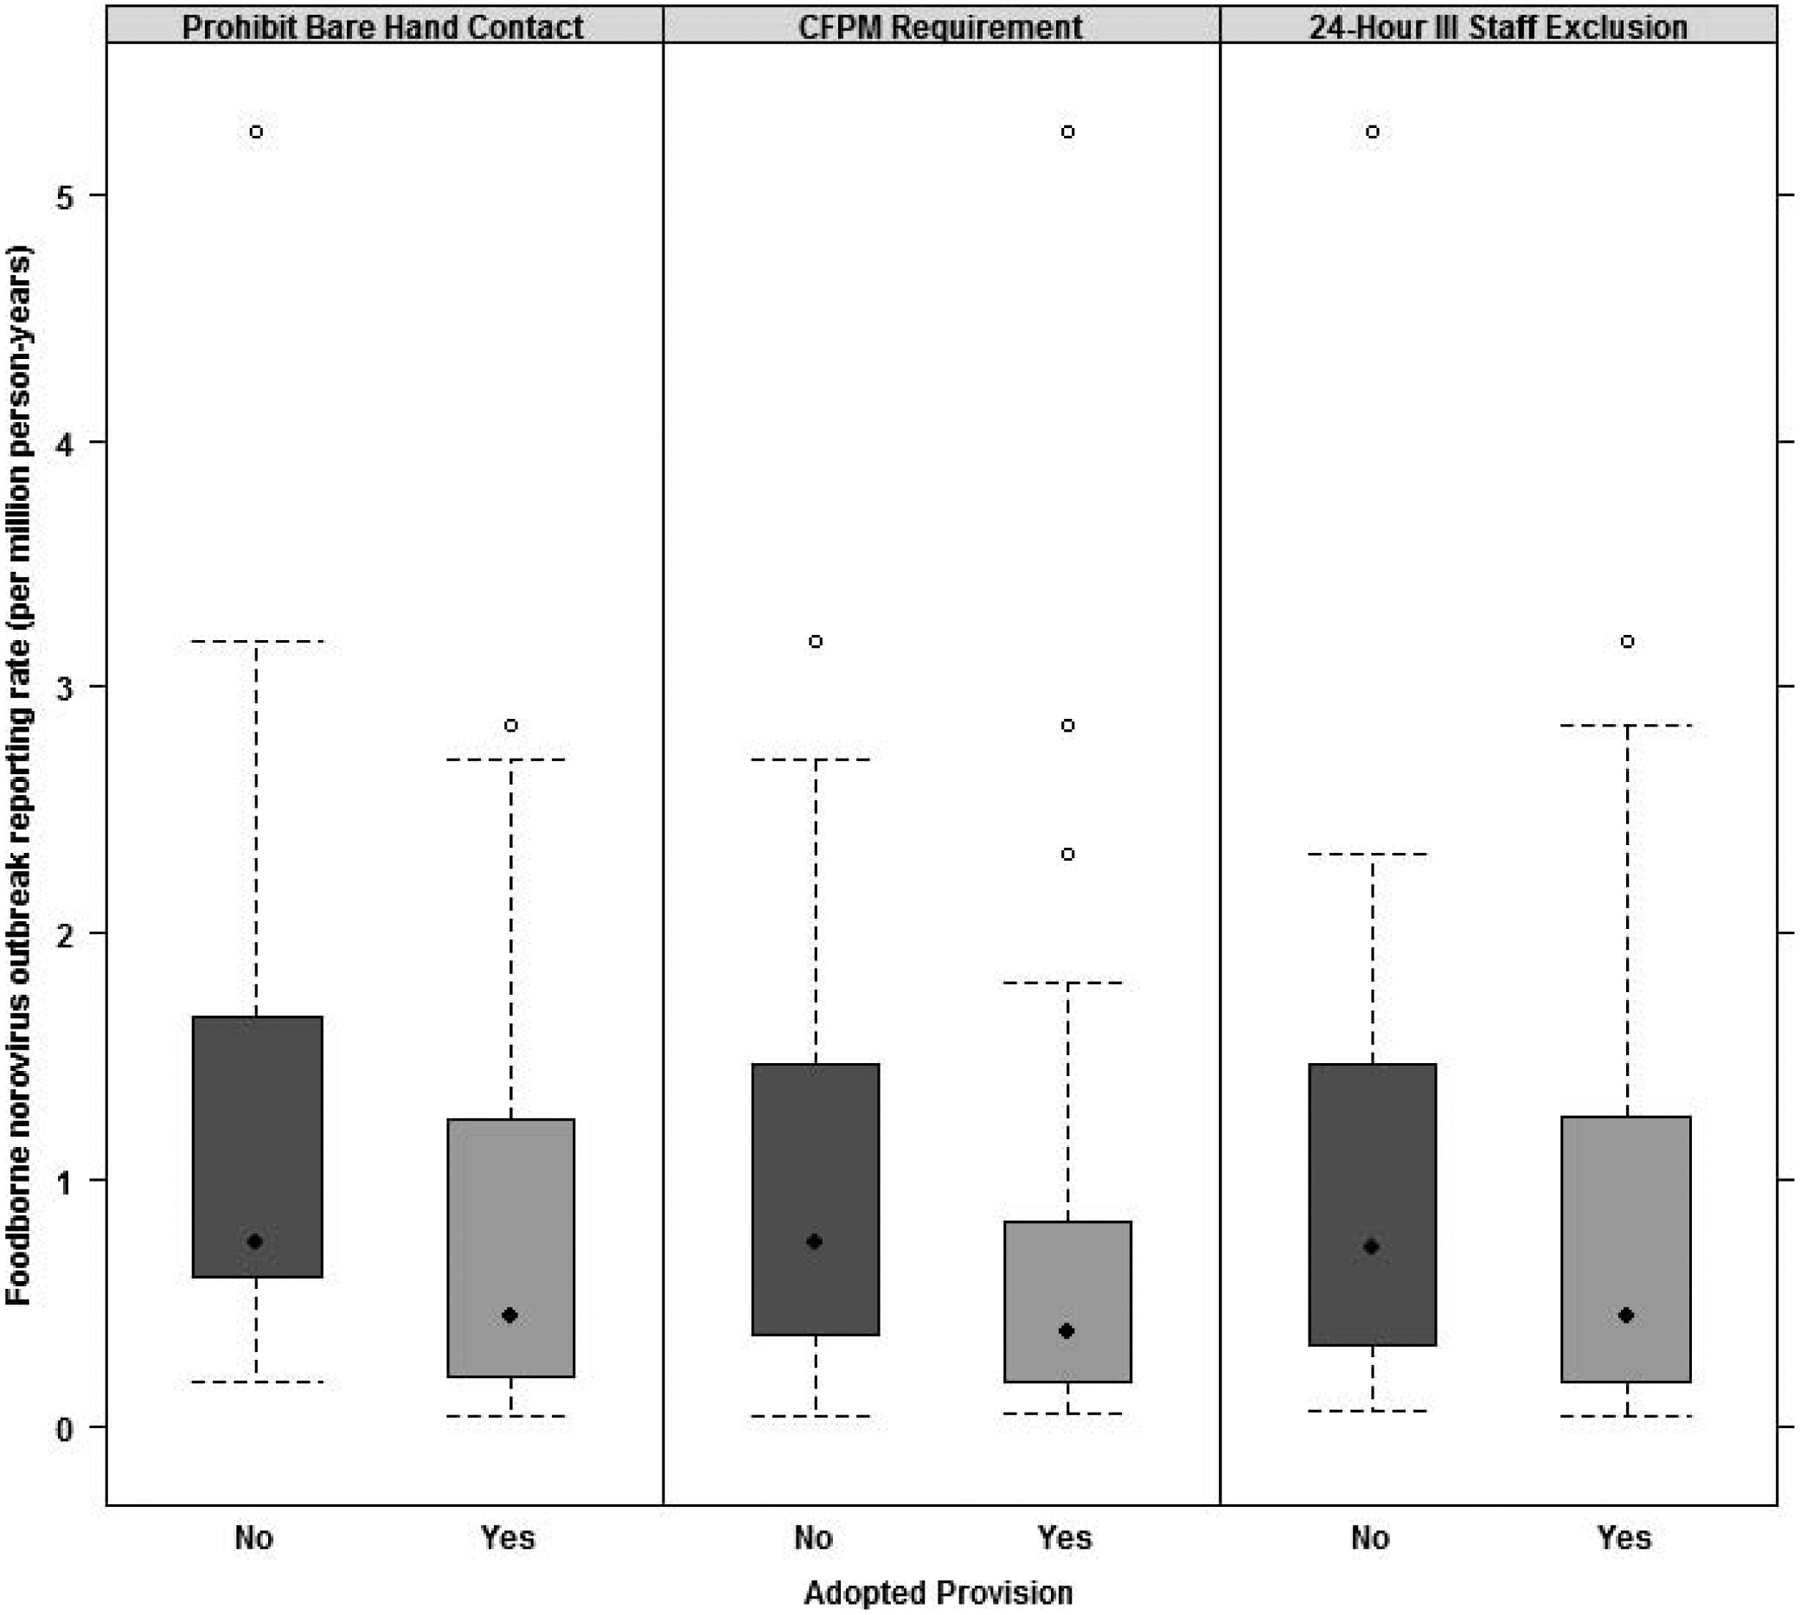
FIGURE 4.

Outbreak reporting rates among 48 states with and without selected food service provisions (three states with no reported outbreaks from 2009 through 2014 were excluded). Solid diamonds denote the median foodborne norovirus outbreak reporting rate among states that did or did not adopt the specified provision; tails indicate the range of reporting rates; open circles indicate outliers.
