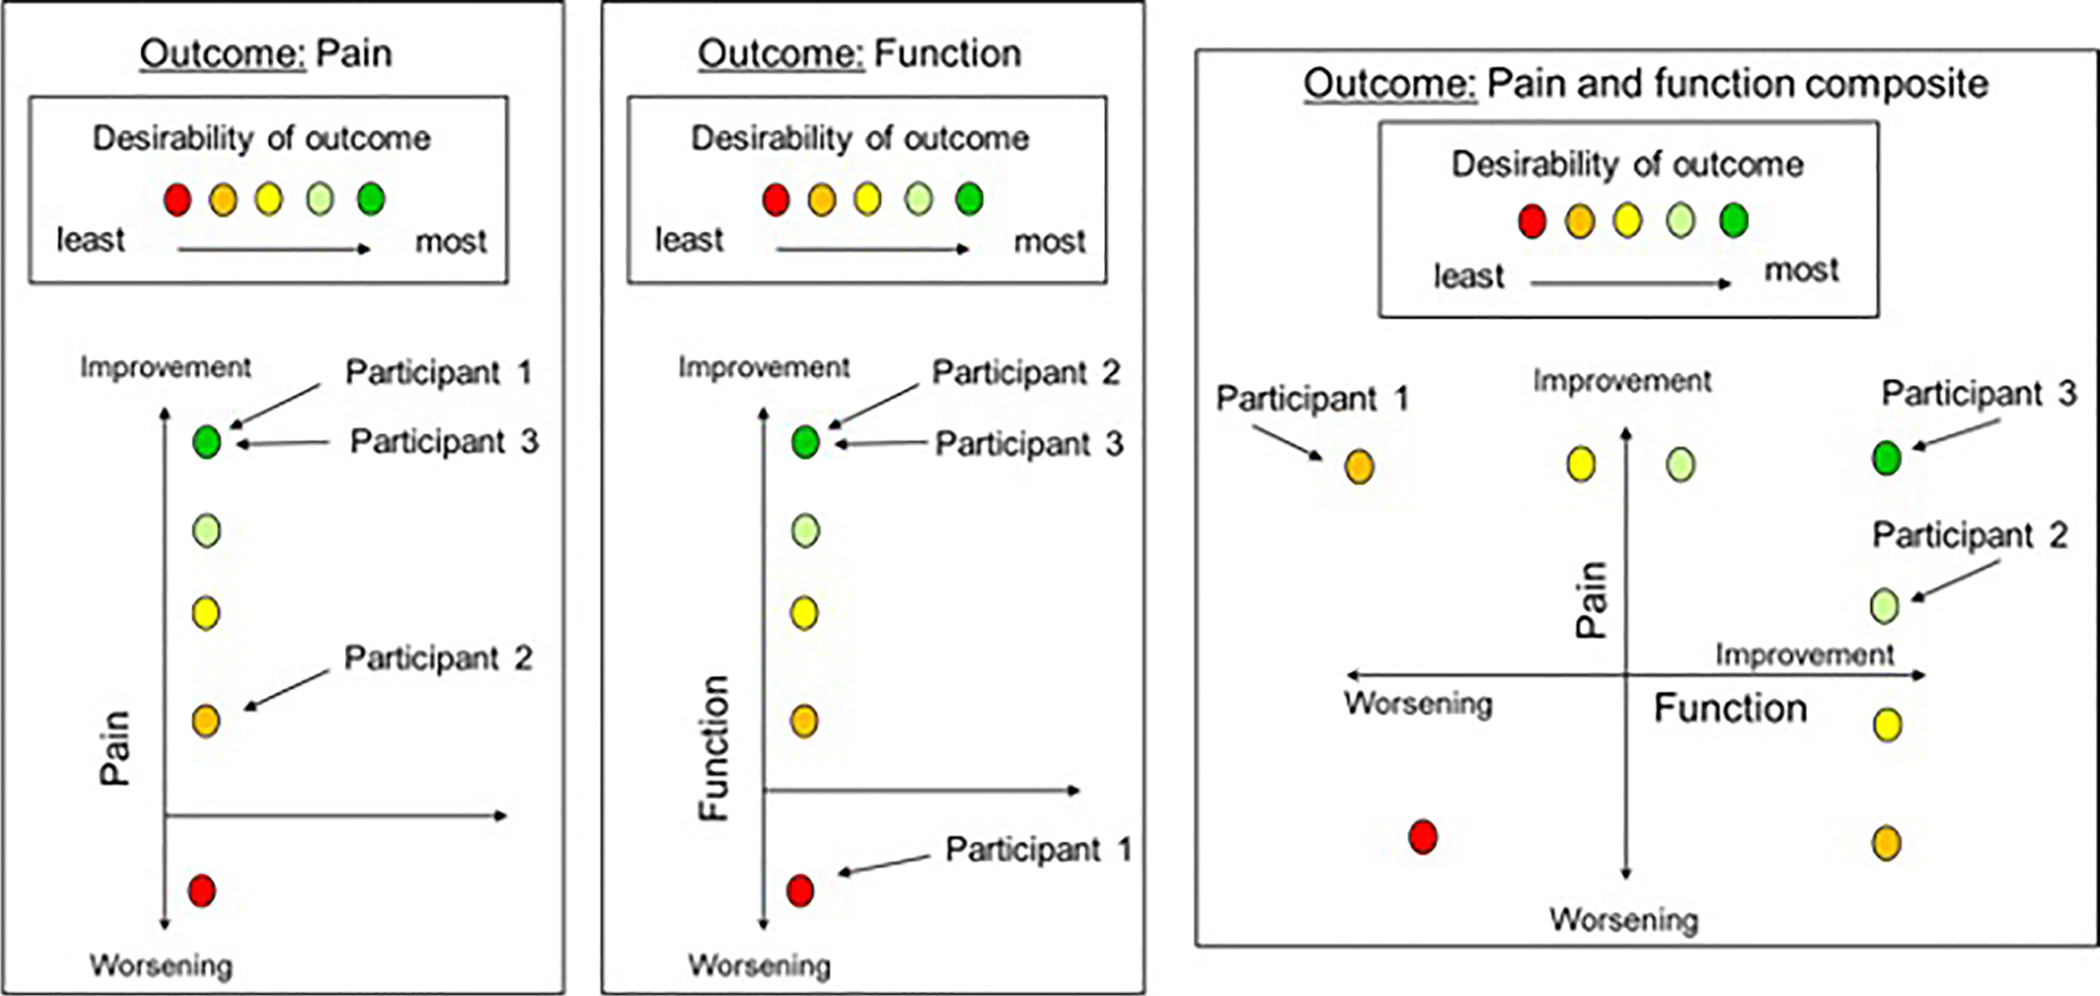
Figure 1.

Composite outcomes provide a more complete overall assessment of each participant. The figure provides an illustrative example of how 3 participants would be ranked differently regarding the desirability of their outcome (i.e., different colors in the figure) using a composite outcome of pain intensity and physical function vs. each of its two components alone. Note that the color of the dots represents the relative desirability of the outcome for hypothetical participants within each outcome and that the desirability of one color, for example yellow, in the pain outcome is not necessarily similar to the desirability of yellow in the function outcome or the composite outcome.
