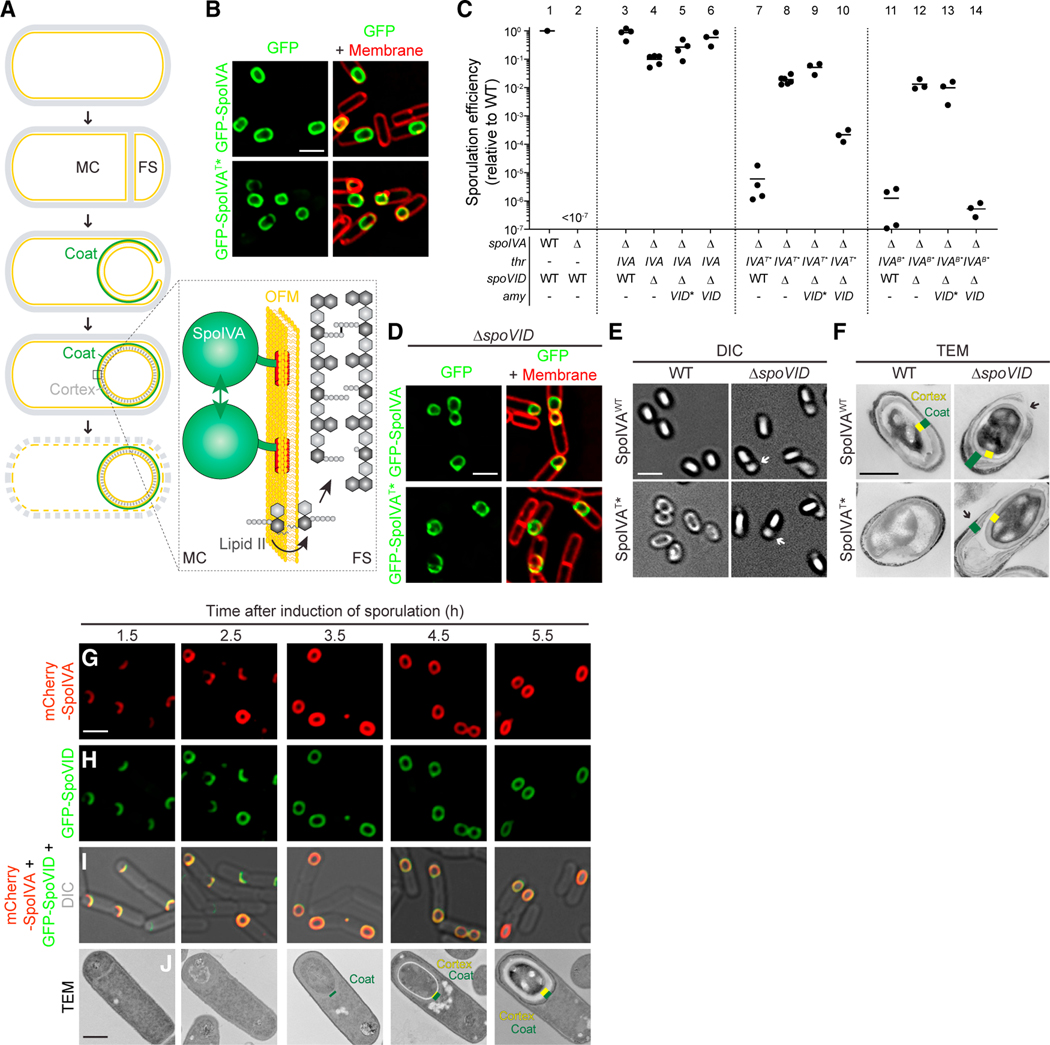
Figure 1. Disrupting spoVID suppresses spore envelope assembly defects caused by mis-assembly of the spore coat basement layer.
(A) Schematic of sporulation in B. subtilis. Sporulation initiates when the rod-shaped progenitor cell (top) asymmetrically divides, producing unequal progeny: a larger mother cell (MC) and smaller forespore (FS). The mother cell then engulfs the forespore (middle panel) and produces ~80 proteins that deposit around the outer forespore membrane to form the coat (green). The forespore is bounded by two membranes: the outer forespore membrane (OFM) originally derived from the mother cell and the inner forespore membrane (IFM), both depicted in yellow. Once coat assembly initiates successfully, the peptidoglycan cortex (gray dashes, fourth panel) assembles between the two membranes surrounding the forespore. Ultimately, the mother cell lyses (bottom), releasing the mature, dormant spore. Membranes depicted in yellow; cell wall depicted in gray. Inset: the basement layer of the spore coat is built with SpoIVA (green), which polymerizes on the MC face of the OFM (yellow). The lipid II peptidoglycan precursor (gray) is also made in the MC, inserts into the OFM, then flips to the intermembrane space, and is incorporated into the assembling cortex.
(B) Subcellular localization of GFP-SpoIVA (top panels) or GFP-SpoIVAT*, a variant that fails to polymerize (bottom panels) in sporulating B. subtilis (strains JPC156 and JPC243) 3 h after induction of sporulation. Left: fluorescence from GFP; right: overlay, fluorescence from GFP and membranes visualized with FM4–64.
(C) Sporulation efficiencies, determined as resistance to heat, relative to WT (PY79). Strain genotypes at spoIVA and spoVID loci are indicated below the graph; thr and amy are ectopic chromosomal loci used to complement spoIVA and spoVID deletions, respectively, with different alleles of those genes. Symbols are independent cultures; bars represent mean values. Strains used: PY79, KP73, KR394, JB171, JB175, JB174, JPC221, JB168, JB177, JB177, JB176, JB103, JB280, JB294, and JB293.
(D) Subcellular localization of GFP-SpoIVA (top panels) or GFP-SpoIVAT* (bottom panels) in the absence of spoVID in sporulating B. subtilis (strains TD300 and TD302) 3 h after induction of sporulation. Size bar: 2 mm.
(E and F) Differential interference contrast (DIC) light microscopy (E; size bar: 2 mm) or transmission electron microscopy (TEM) images (F; size bar: 500 nm) of released spores harboring WT (top) or T* alleles of spoIVA in WT (left) or ΔspoVID (right) strains (strains KR394, JPC221, JB171, JB168). Yellow indicates cortex; green indicates coat.
(G–I) Subcellular localization of (G) mCherry-SpoIVA and (H) GFP-SpoVID in sporulating WT cells (strain TD1074) imaged at the indicated times after induction of sporulation. (I) Overlay of mCherry and GFP fluorescence; size bar: 2 μm. (J) TEM of a representative WT sporulating cell (strain PY79) harvested at indicated time points after induction of sporulation. Yellow indicates cortex; green indicates coat; size bar: 500 nm. Strain genotypes are listed in STAR Methods (see also Figure S1A).

