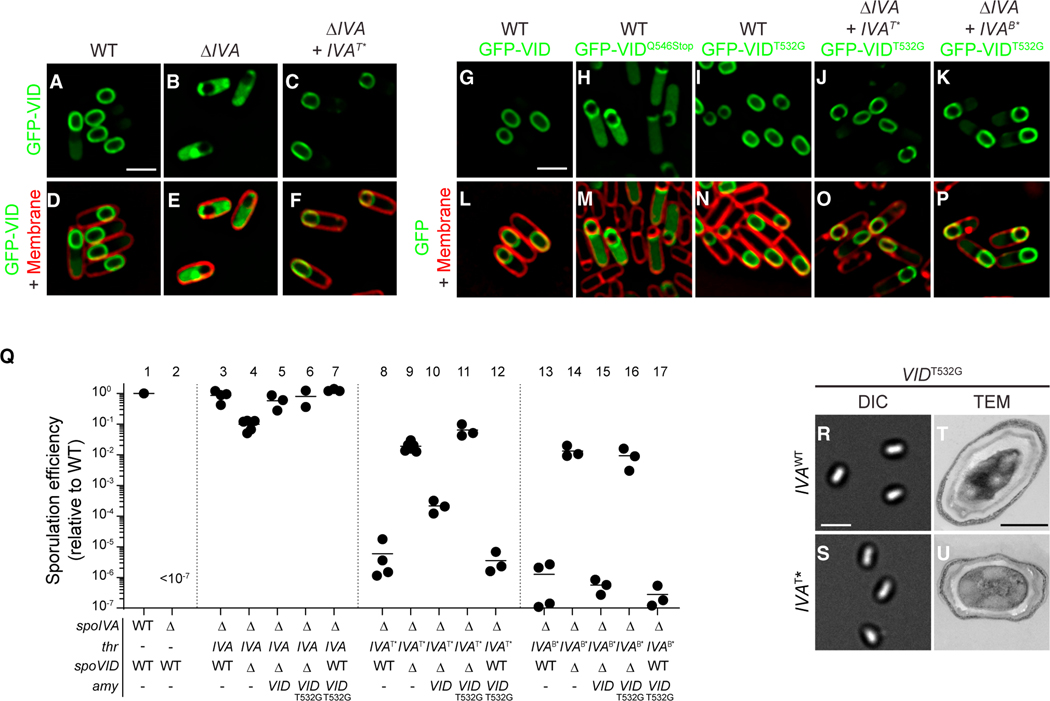
Figure 3. Disrupting the LysM domain of SpoVID suppresses coat assembly defects.
(A–P) Subcellular localization of (A–F) GFP-SpoVID in WT (A and D), absence of spoIVA (B and E), or presence of spoIVAT* (C and F); (G, P) GFP-SpoVID, (G and L) GFP-SpoVIDQ546Stop, and (H and M) GFP-SpoVIDT532G in otherwise WT background; and GFP-SpoVIDT532G in the presence of (I and N) spoIVA, (J and O) spoIVAT*, or (K and P) spoIVAB* cells 3.5 h after induction of sporulation (strains TD139, TD172, TD144, TD139, TD154, TD251, TD954, and TD953). (A–C and G–K) Fluorescence from GFP; (D–F and L–P) overlay of fluorescence from GFP and membranes stained with FM4–64; size bar: 2 μm.
(Q) Sporulation efficiencies, determined as resistance to heat, relative to WT (PY79). Strain genotypes at spoIVA and spoVID loci are indicated below the graph; thr and amy are ectopic chromosomal loci used to complement spoIVA and spoVID deletions, respectively, with indicated alleles of those genes. Symbols are independent cultures; bars represent mean values. Strains used: PY79, KP73, KR394, JB171, JB174, JB281, TD1139, JPC221, JB168, JB176, JB242, TD1140, JB103, JB280, JB293, JB295, and TD1141.
(R–U) Morphologies of spores harboring (R and T) WT or (S and U) T* alleles of spoIVA in the presence of spoVIDT532G as visualized using (R–S; size bar: 2 μm) DIC light microscopy or (T and U; size bar: 500 nm) TEM (strains JB281 and JB242) (see also Figures S1B and S1C).

