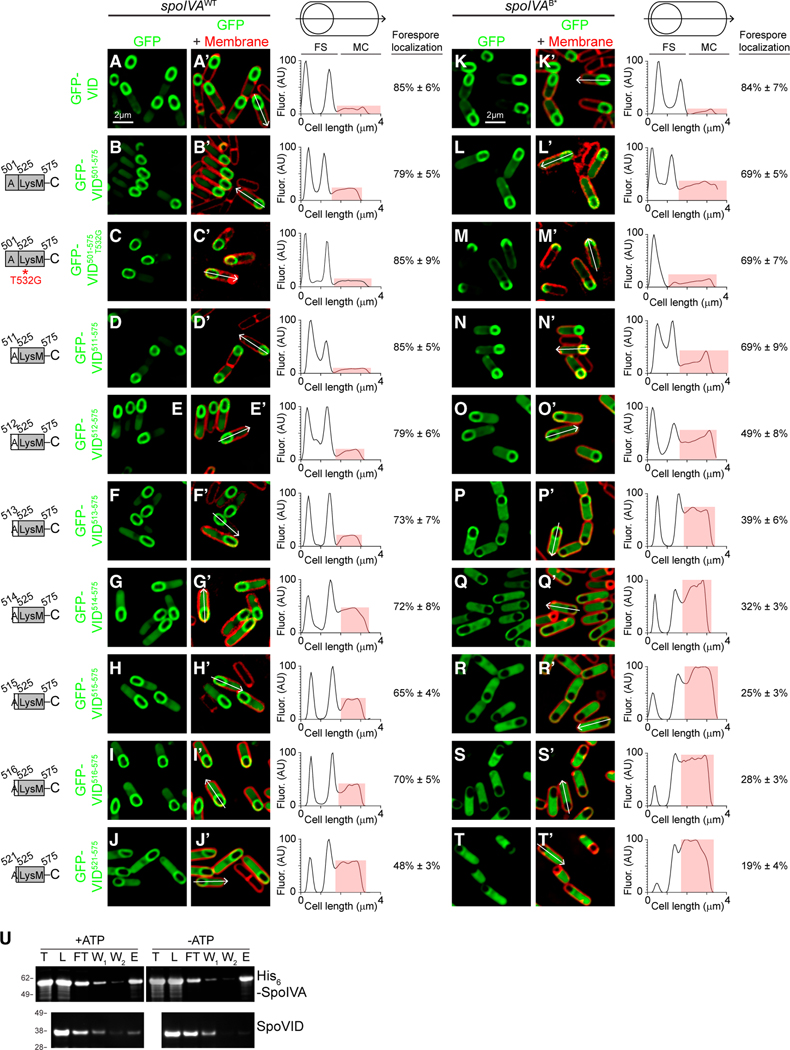
Figure 6. The carboxy terminus of SpoVID can detect the polymerization state of SpoIVA.
(A–T′) Subcellular localization of indicated sequential truncations of SpoVID C-terminal fragments fused to GFP in sporulating cells 3.5 h after induction of sporulation in the presence of (A–J′) WT or (K–T′) B* variant of SpoIVA. A–T: fluorescence from GFP; A′–T′: overlay of fluorescence from GFP and membranes stained with FM4–64. Arrows indicate linescan used to quantify GFP fluorescence intensity along an individual sporangium; quantification of the linescan of the single indicated cell shown to the right (red highlights GFP fluorescence intensity localized in the mother cell cytosol), along with mean fraction of forespore-localized fluorescence intensity (n = 10 cells; errors are SD). Size bar: 2 mm. Strains used: TD139, TD931, TD955, TD996, TD998, TD999, TD1000, TD1001, TD1002, TD997, TD142, TD933, TD957, TD961, TD979, TD980, TD981, TD982, TD983, and TD962. (U) Representative immunoblot of SpoIVA and GFP-SpoVID501–575 with polymerized SpoIVA (+ATP) or nonpolymerized SpoIVA (−ATP). Total amount of SpoIVA before polymerization (T), proteins loaded onto the affinity column after SpoIVA polymerization and SpoVID interaction (L), column flow through (FT), first and second column washes (W1, W2), proteins eluted from the column (E).

