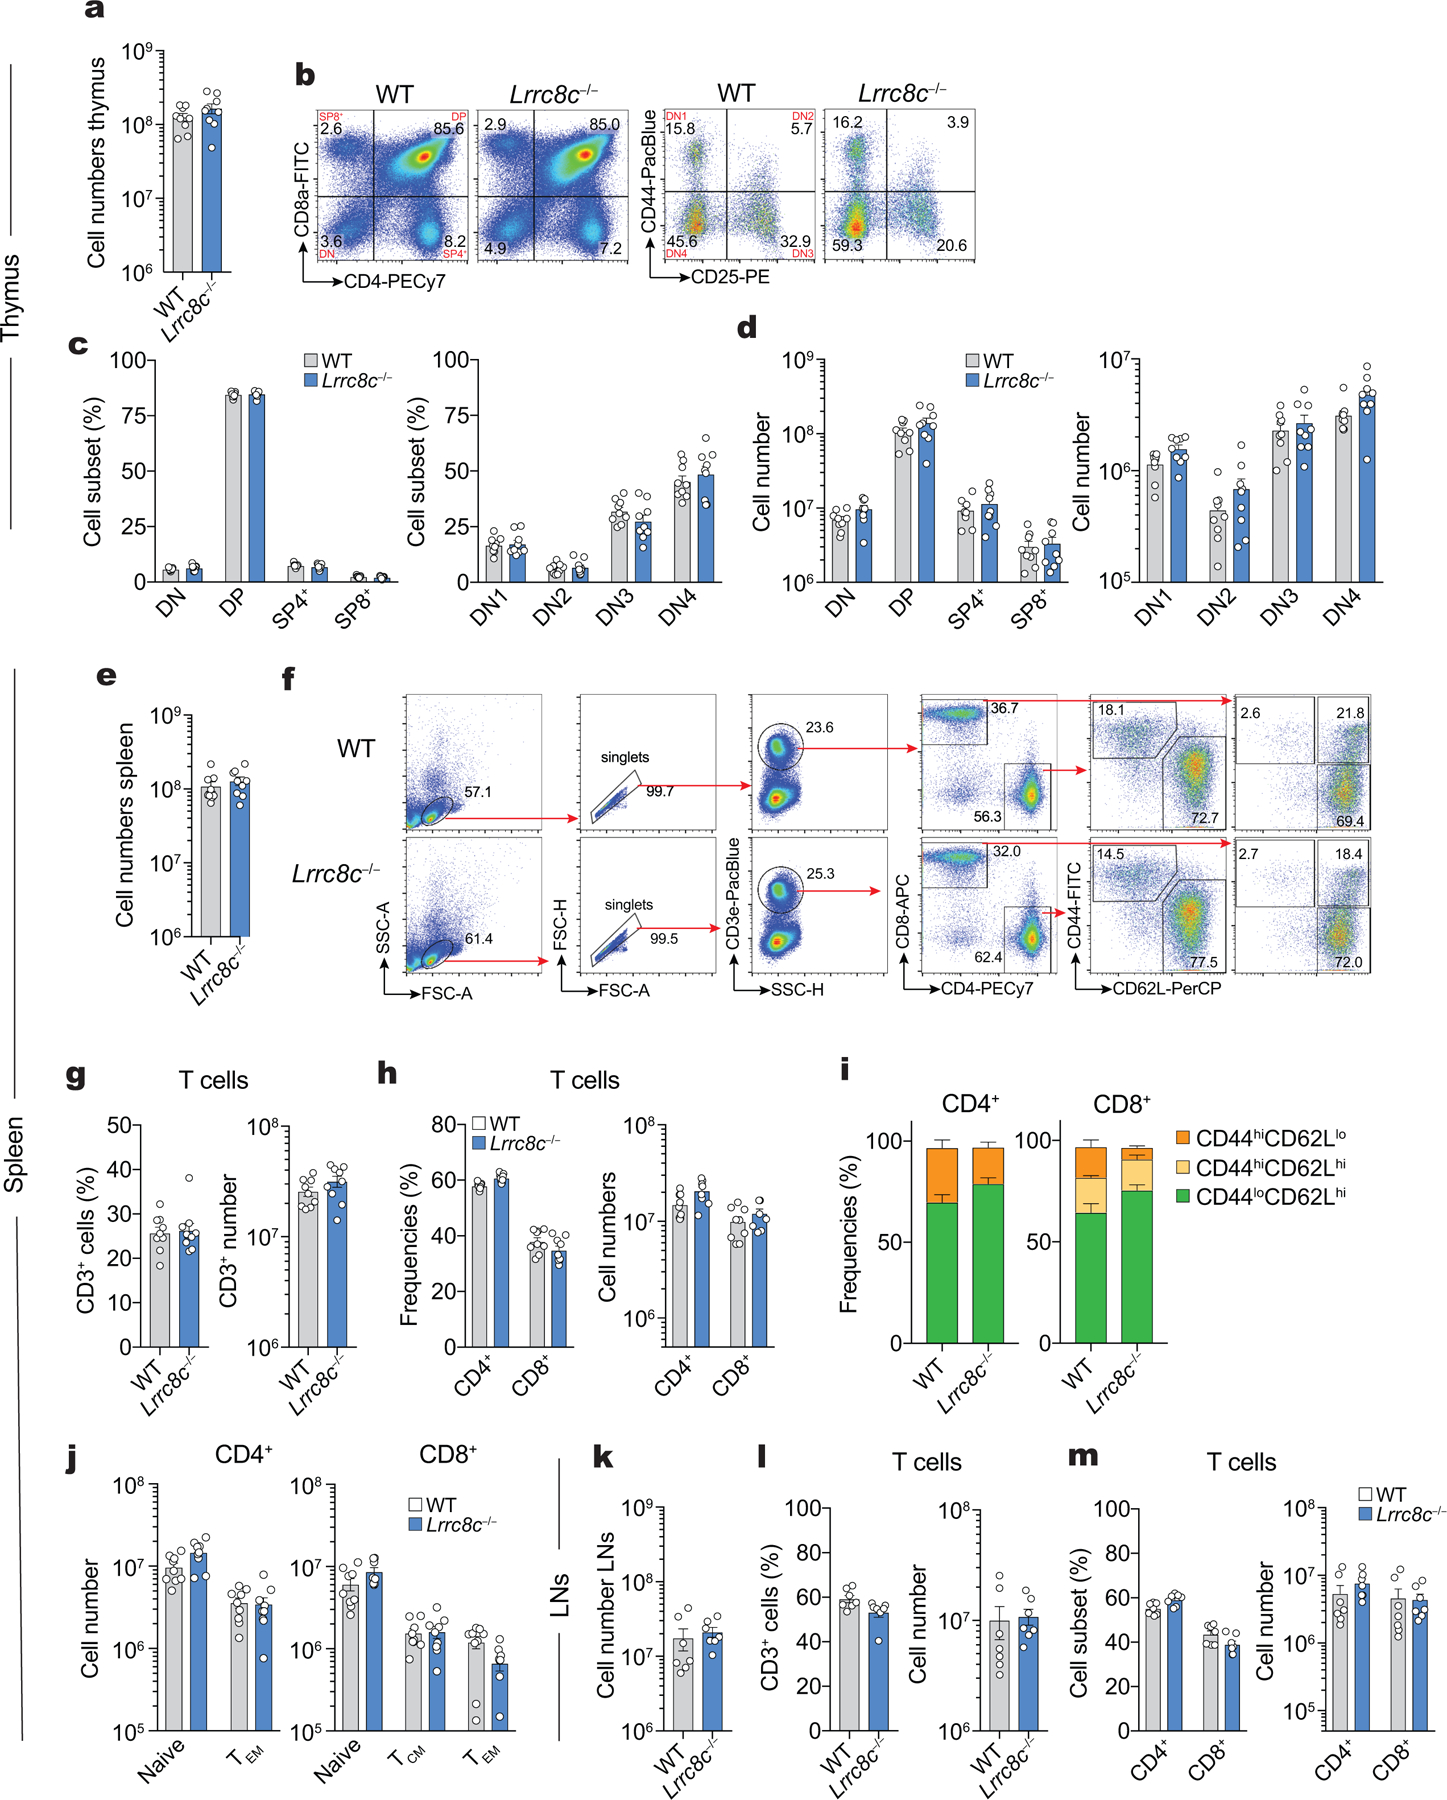
Extended Data Figure 3. Lrrc8c−/− mice have normal T cell development.

(a-d) Cell numbers and proportion of thymocytes from WT and Lrrc8c−/− mice. (a) Absolute cell numbers, (b) representative flow cytometry plots showing the proportion (c) and numbers (d) of thymocyte subsets DN1, DN2, DN3, DN4, DP, SP4+ and SP8+ cells. (e-j) Cell numbers and proportion of splenocytes from WT and Lrrc8c−/− mice. (e) Absolute cell numbers, (f) representative flow cytometry plots showing the gating strategy to identify the different subsets of T cells in the spleen from WT and Lrrc8c−/− mice. Proportion and absolute cell numbers of (g) CD3+ T cells, (h) CD4+ and CD8+ T cells, and (i,j) naïve CD44loCD62Lhi, T central memory (TCM) CD44hiCD62Lhi, and T effector memory (TEM) CD44hiCD62Llo T cell subsets in both CD4+ and CD8+ T cells. (k-m) Cell number and proportion of T cells in the lymph nodes (LNs) from WT and Lrrc8c−/− mice. (k) Absolute cell numbers, and proportion and absolute cell numbers of (l) CD3+ T cells, and (m) CD4+ and CD8+ T cells. Data represent mean ± s.e.m. of 9 mice per genotype (a-j) and 7 mice per genotype (k-m), pooled from at least 4 independent experiments.
