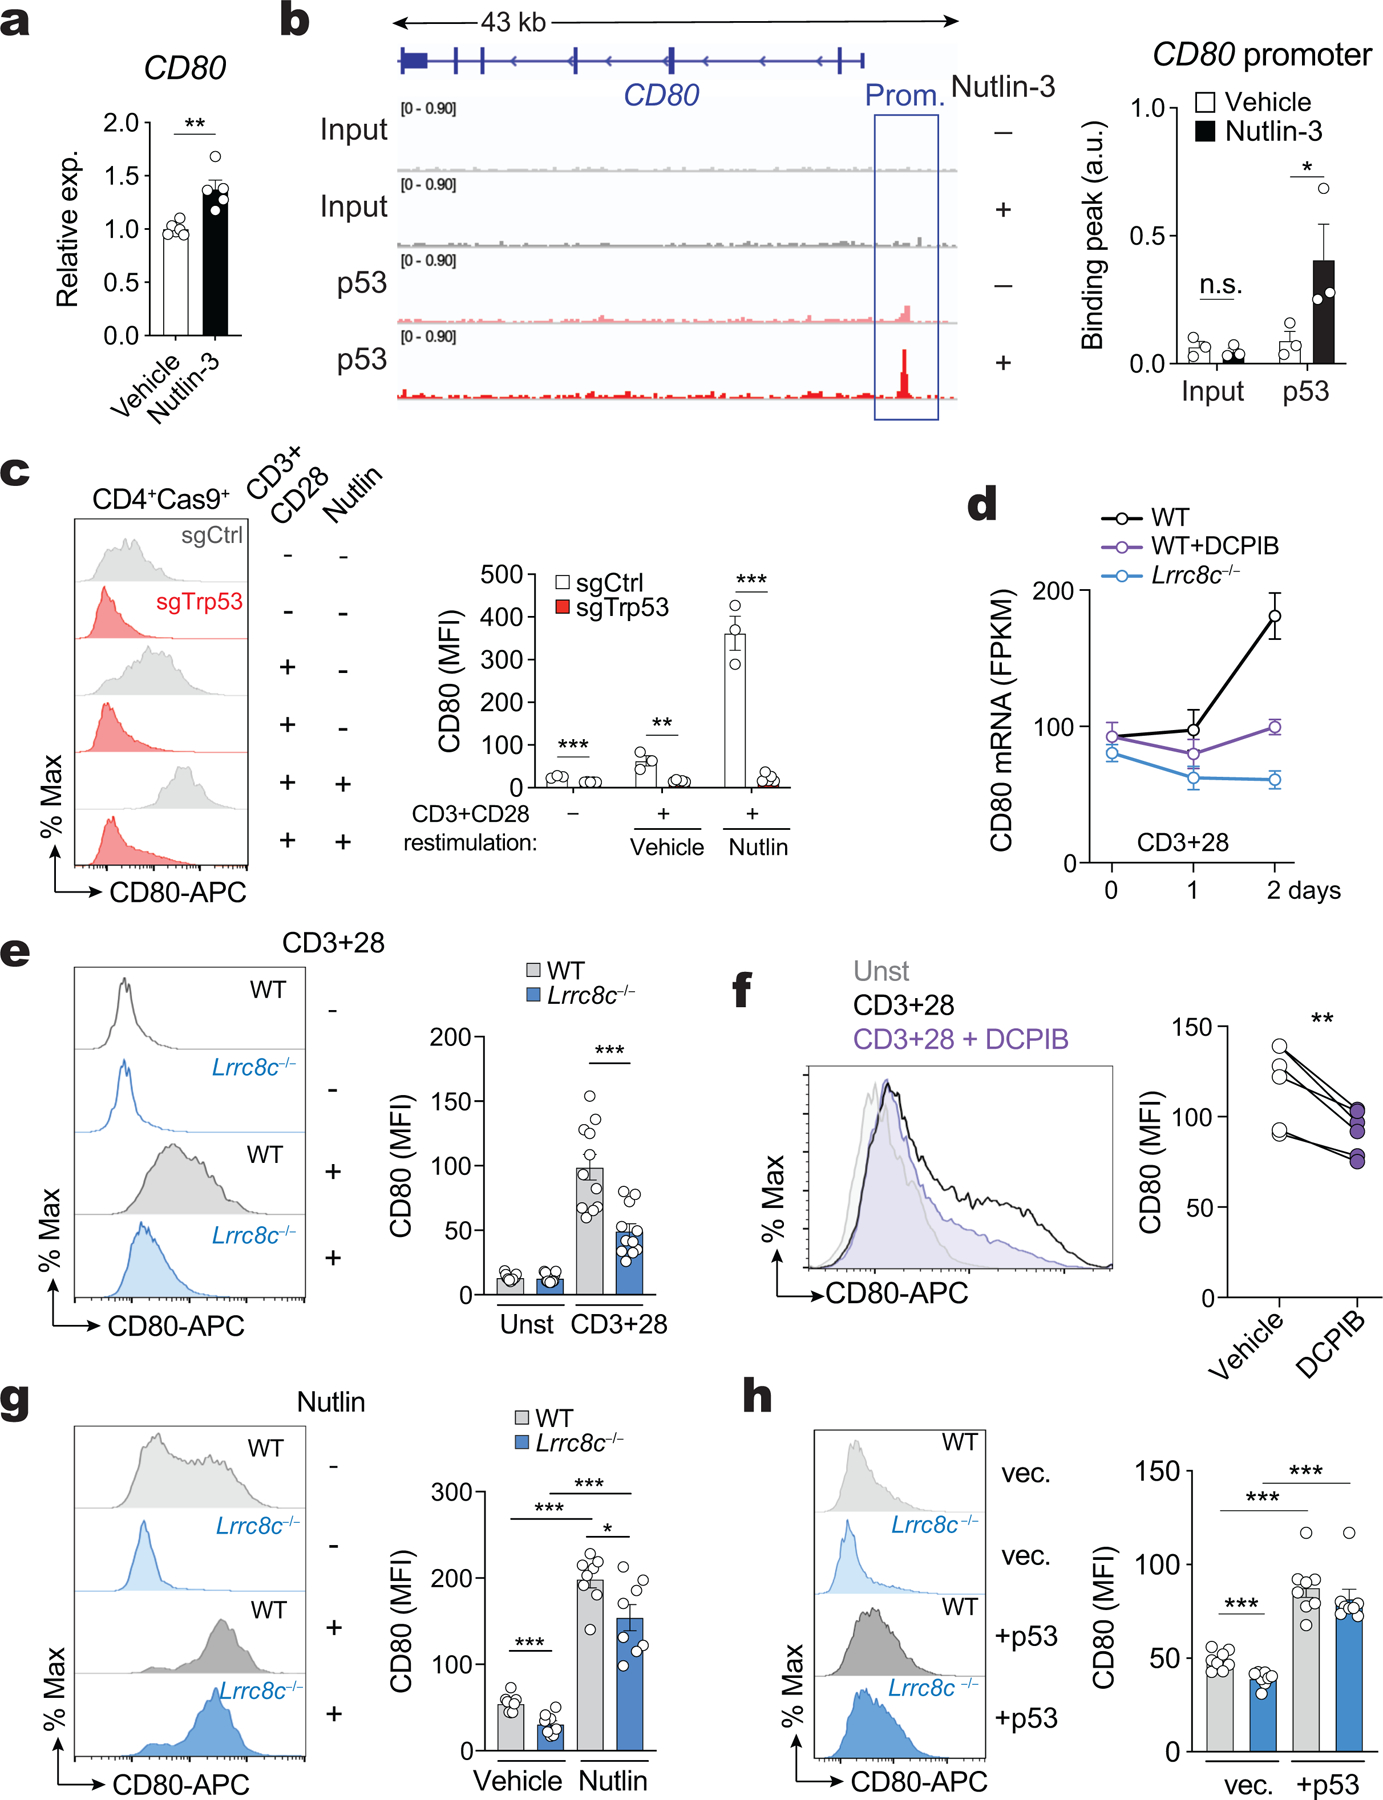
Extended Data Figure 6. p53 controls CD80 expression in T cells.

(a) CD80 mRNA expression in human T cells from healthy volunteers stimulated with phytohemagglutinin for 3 days and treated with nutlin-3 for 24h. CD80 mRNA expression based on microarray data from GSE110369 (Ref62). (b) p53 binding to the CD80 gene locus in human T cells treated as in (a) and analyzed by ChIP-Seq (data source: GSE110368)62. Representative binding peaks in the CD80 promoter (left) and quantification (right). (c) CD80 expression in CD4+Cas9+ T cells transduced with sgRNAs targeting p53 (Trp53) and restimulated for 3 days with anti-CD3+28 and treated or not with nutlin. Representative flow cytometry plots (left) and quantification (right) of mean fluorescence intensities (MFI) of CD80. Data are from 3 and 5 mice for sgControl and sgTrp53, respectively, pooled from 2 independent experiments. (d) Cd80 mRNA expression in CD4+ T cells of WT or Lrrc8c−/− mice stimulated with anti-CD3/28 for 1 and 2 days. T cells from WT mice were treated or not with DCPIB for the duration of T cell stimulation. mRNA expression based on RNA-Seq data (compare with Fig. 3). Data are from 3 mice per genotype and treatment. (e) CD80 expression in WT and Lrrc8c−/− CD4+ T cells before and after stimulation with anti-CD3+28 for 3 days. Representative flow cytometry plots (left) and quantification (right) from 11 mice per genotype, pooled from 4 independent experiments. (f) CD80 expression in WT CD4+ T cells treated with 20 μM DCPIB for 3 days following anti-CD3+28 stimulation. Representative overlay histograms (left) and quantification (right) of CD80 expression from 6 mice per condition. (g,h) CD80 cell expression in WT and Lrrc8c−/− CD4+ T cells upon stimulation with anti-CD3+28 for 3 days and treated or not with nutlin (in g), or after 3 days of retroviral transduction with empty vector or p53 (in h). Representative flow cytometry plots (left) and quantification (right) of 8 mice per genotype, pooled from 4 and 2 independent experiments in (g) and (h), respectively. All data are mean ± s.e.m. and were analyzed by two-tailed, unpaired Student’s t test (a-c,e,g,h) and by two-tailed, paired t test (f). Not significant (n.s.) P > 0.05, *P<0.05, **P<0.01 and ***P<0.001.
