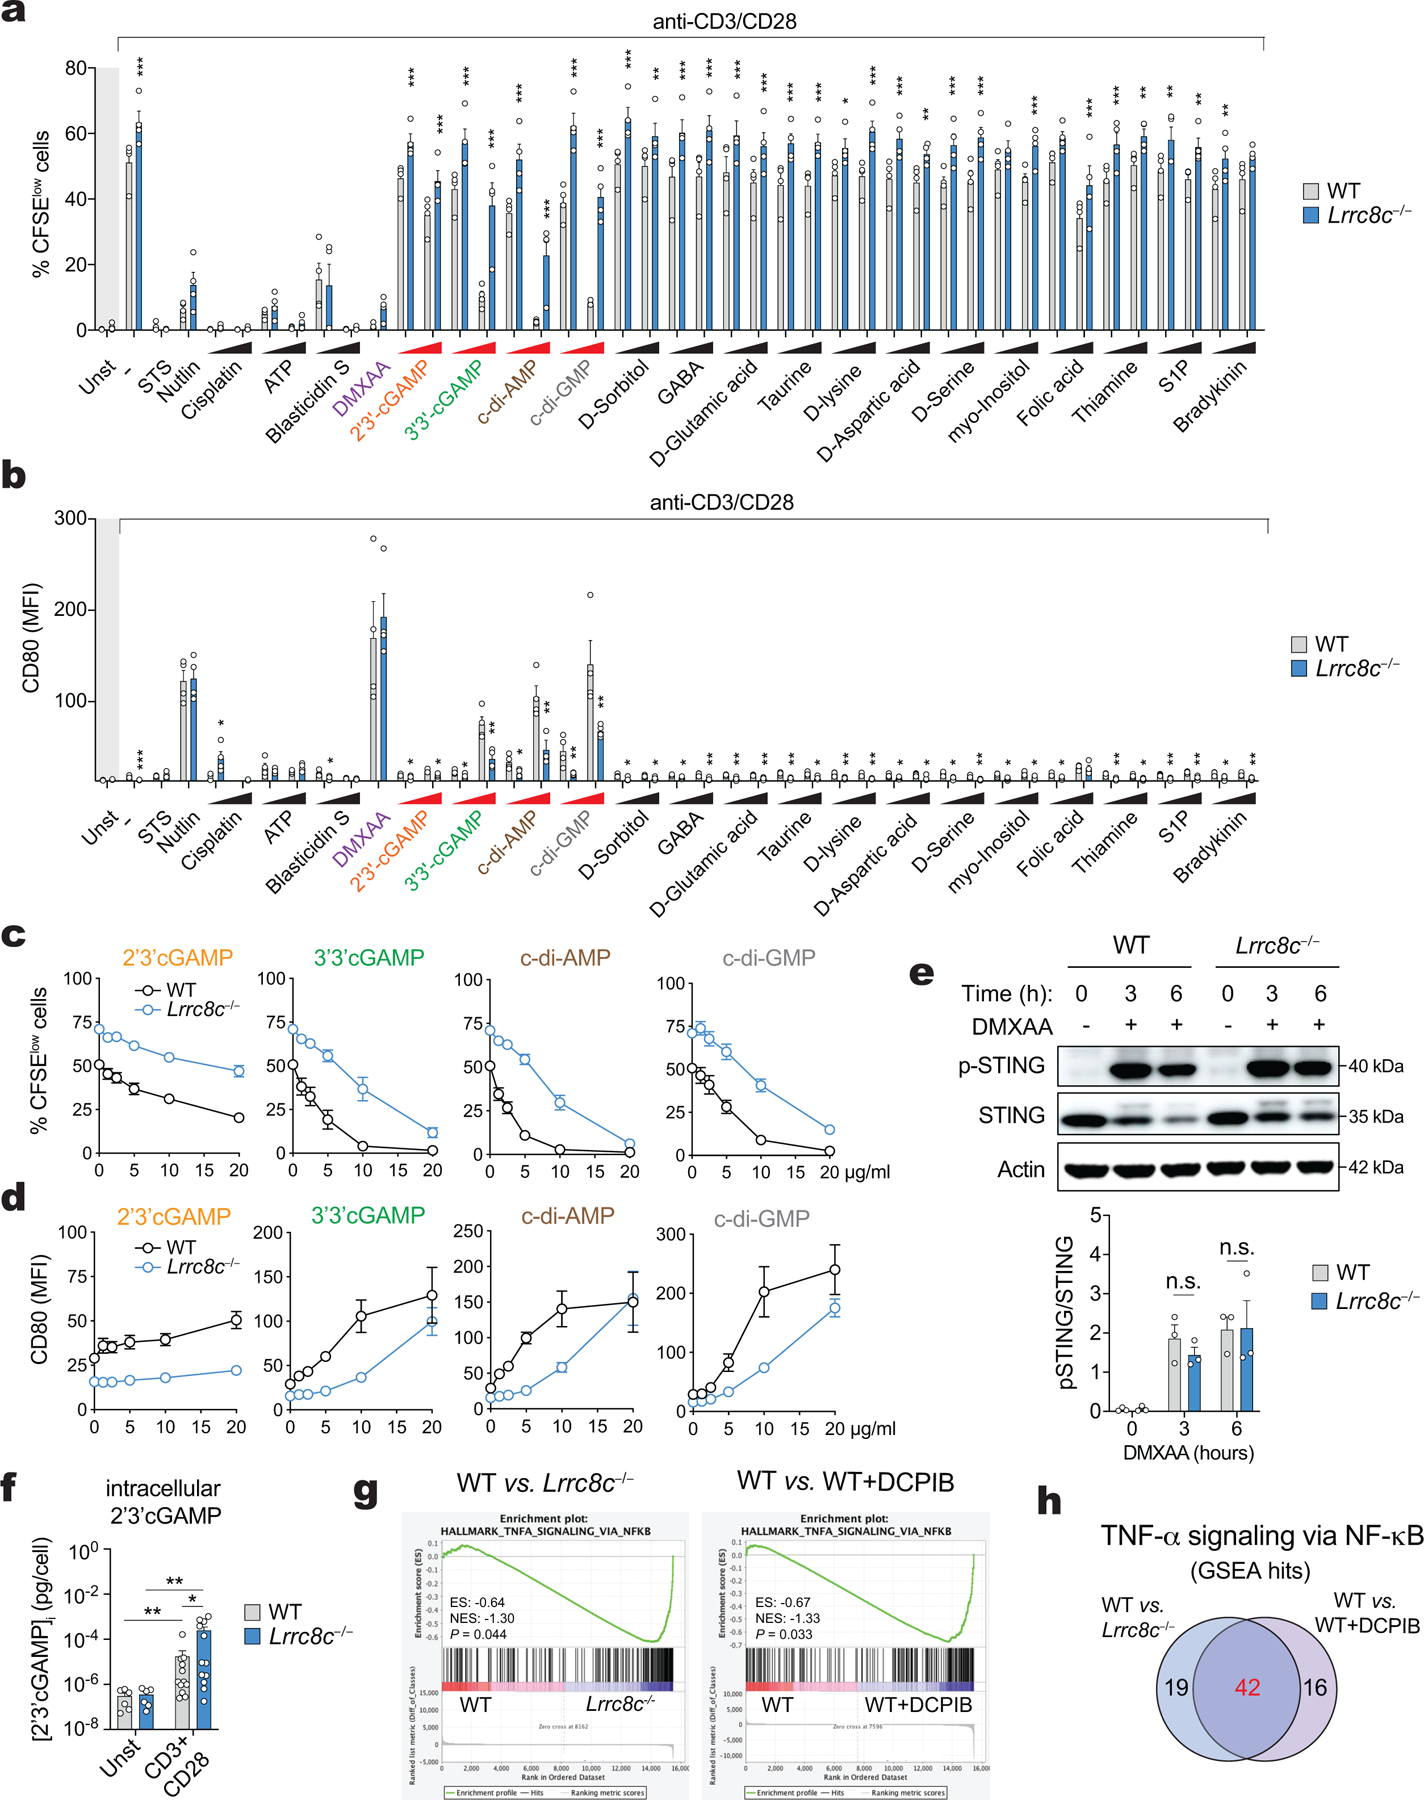
Extended Data Figure 7. Activation of STING in T cells depends on the channel function of LRRC8C.

(a,b) Compound screening to identify substrates for LRRC8C in T cells. Flow cytometry analysis showing (a) the CFSE dilution and (b) CD80 surface expression of CD4+ T cells stimulated for 2 days with anti-CD3+28 dynabeads and treated with 19 different substrates known to be transported by VRAC channels. The concentration of tested compounds is: 3 and 10 μg/ml for 2’3’cGAMP, 3’3’cGAMP, c-di-AMP, and c-di-GMP; 5 and 10 μg/ml Blasticidin S, 0.1 and 1 μM sphingosine 1-phosphate (S1P), 1 and 10 μM bradykinin acetate, 50 and 100 μM cisplatin, 100 and 200 μM folic acid, 100 and 500 μM GABA, myo-inositol and thiamine hydrochloride; 250μM and 1 mM ATP, D-glutamic acid, taurine, D-lysine, D-aspartic acid, D-serine; 500μM and 1 mM D-sorbitol. The concentration of positive controls that lack requirement for VRAC transport are: 3 μg/ml DMXAA, 1 μM staurosporine (STS), and 5 μM idasanutlin (Nutlin). Data are from 4 mice per genotype, pooled from 2 independent experiments. Area highlighted in light grey represents unstimulated conditions. (c,d) Dose-dependent effects of CDNs on (c) proliferation measured by CFSE dilution and (d) CD80 expression in WT and Lrrc8c−/− CD4+ T cells stimulated for 2 days with anti-CD3+28. Data are from 6 mice per genotype and treatment, pooled from 3 independent experiments. (e) Immunoblots of total and p-STING (S366) protein in WT and Lrrc8c−/− CD4+ T cells activated for 2 days with anti-CD3+28 and treated with 3 μg/ml DMXAA at the indicated time points. Actin was used as loading control. Representative blot (top) and quantification (bottom) from at least 2 independent experiments. (f) Intracellular concentration of 2’3’ cGAMP in T cells stimulated with anti-CD3+28 for 12–72 hours and measured by ELISA. Data are from 6 (unstimulated) and 12 (stimulated) T cell samples, pooled from 12 mice per genotype and 2 independent experiments. (g) GSEA of RNA-Seq data from WT, Lrrc8c−/−, and WT + DCPIB-treated CD4+ T cells identifies DEGs associated with TNF-α signaling via NFκB pathway after anti-CD3+28 stimulation. (h) Venn-diagram showing number of DEGs related to the TNF-α signaling via NFκB pathway between WT vs. Lrrc8c−/− and WT vs. WT + DCPIB CD4+ T cells after anti-CD3+28 stimulation for 1 and 2 days. All data are the mean ± s.e.m. and were analyzed by two-tailed, unpaired Student’s t test. Not significant (n.s.) P > 0.05, *P<0.01, **P<0.01 and ***P<0.001.
