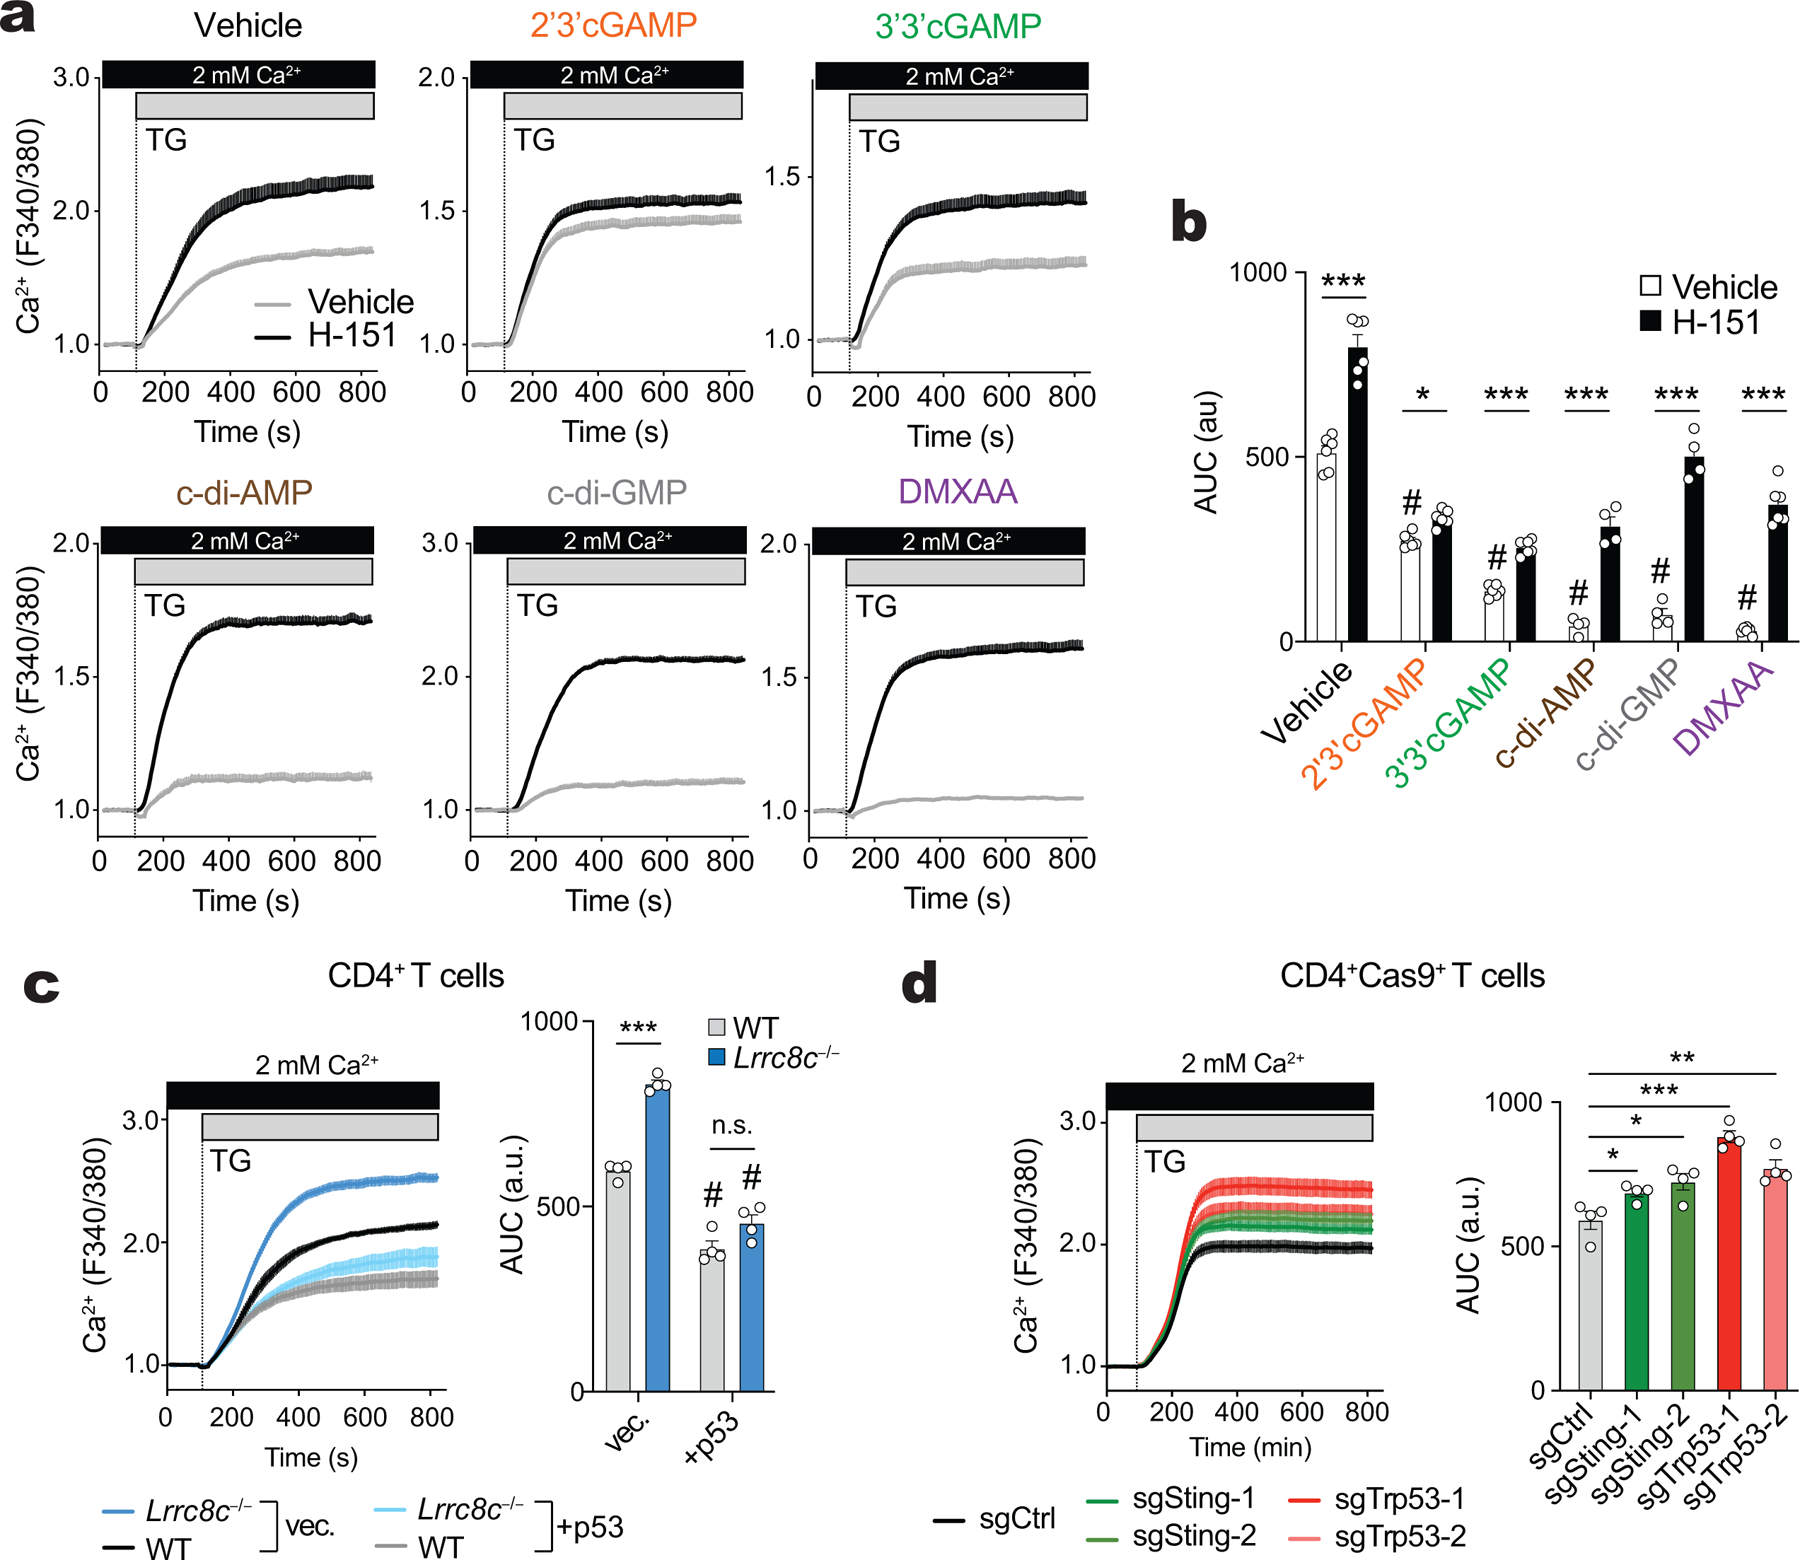
Extended Data Figure 10. LRRC8C-STING-p53 signaling modulates Ca2+ influx in T cells.

(a,b) Cytosolic Ca2+ signals in WT T cells stimulated for 3 days with anti-CD3+28 and treated or not with the STING inhibitor H-151 and STING agonists. T cells were stimulated with thapsigargin (TG) in Ca2+-containing Ringer buffer. Averaged Ca2+ traces (a) and area under the curve (AUC) following TG treatment (b). Data are the mean ± s.e.m. of 6 mice (vehicle, DMXAA, 2’3’cGAMP, 3’3cGAMP) or 4 mice (c-di-AMP, c-di-GMP) pooled from 2–3 independent experiments. (c) Cytosolic Ca2+ signals in WT and Lrrc8c−/− T cells 3 days after retroviral transduction with p53 using a similar protocol as in (a). Averaged Ca2+ traces (left) and quantification of the AUC (right) following TG treatment. Data are the mean ± s.e.m. of 4 mice per genotype and treatment, pooled from 2 independent experiments. (d) Cytosolic Ca2+ signals in CD4+Cas9+ T cells transduced with sgRNAs targeting STING and p53 three days after retroviral transduction using a similar protocol as in (a). Averaged Ca2+ traces (left) and quantification of the AUC (right) after TG treatment. Data are the mean ± s.e.m. of 3 mice pooled from 2 independent experiments. Statistical analysis by two-tailed, unpaired Student’s t test. Not significant (n.s.) P > 0.05, **P<0.01 and ***P<0.001. #P<0.001 between treatment vs vehicle untreated.
