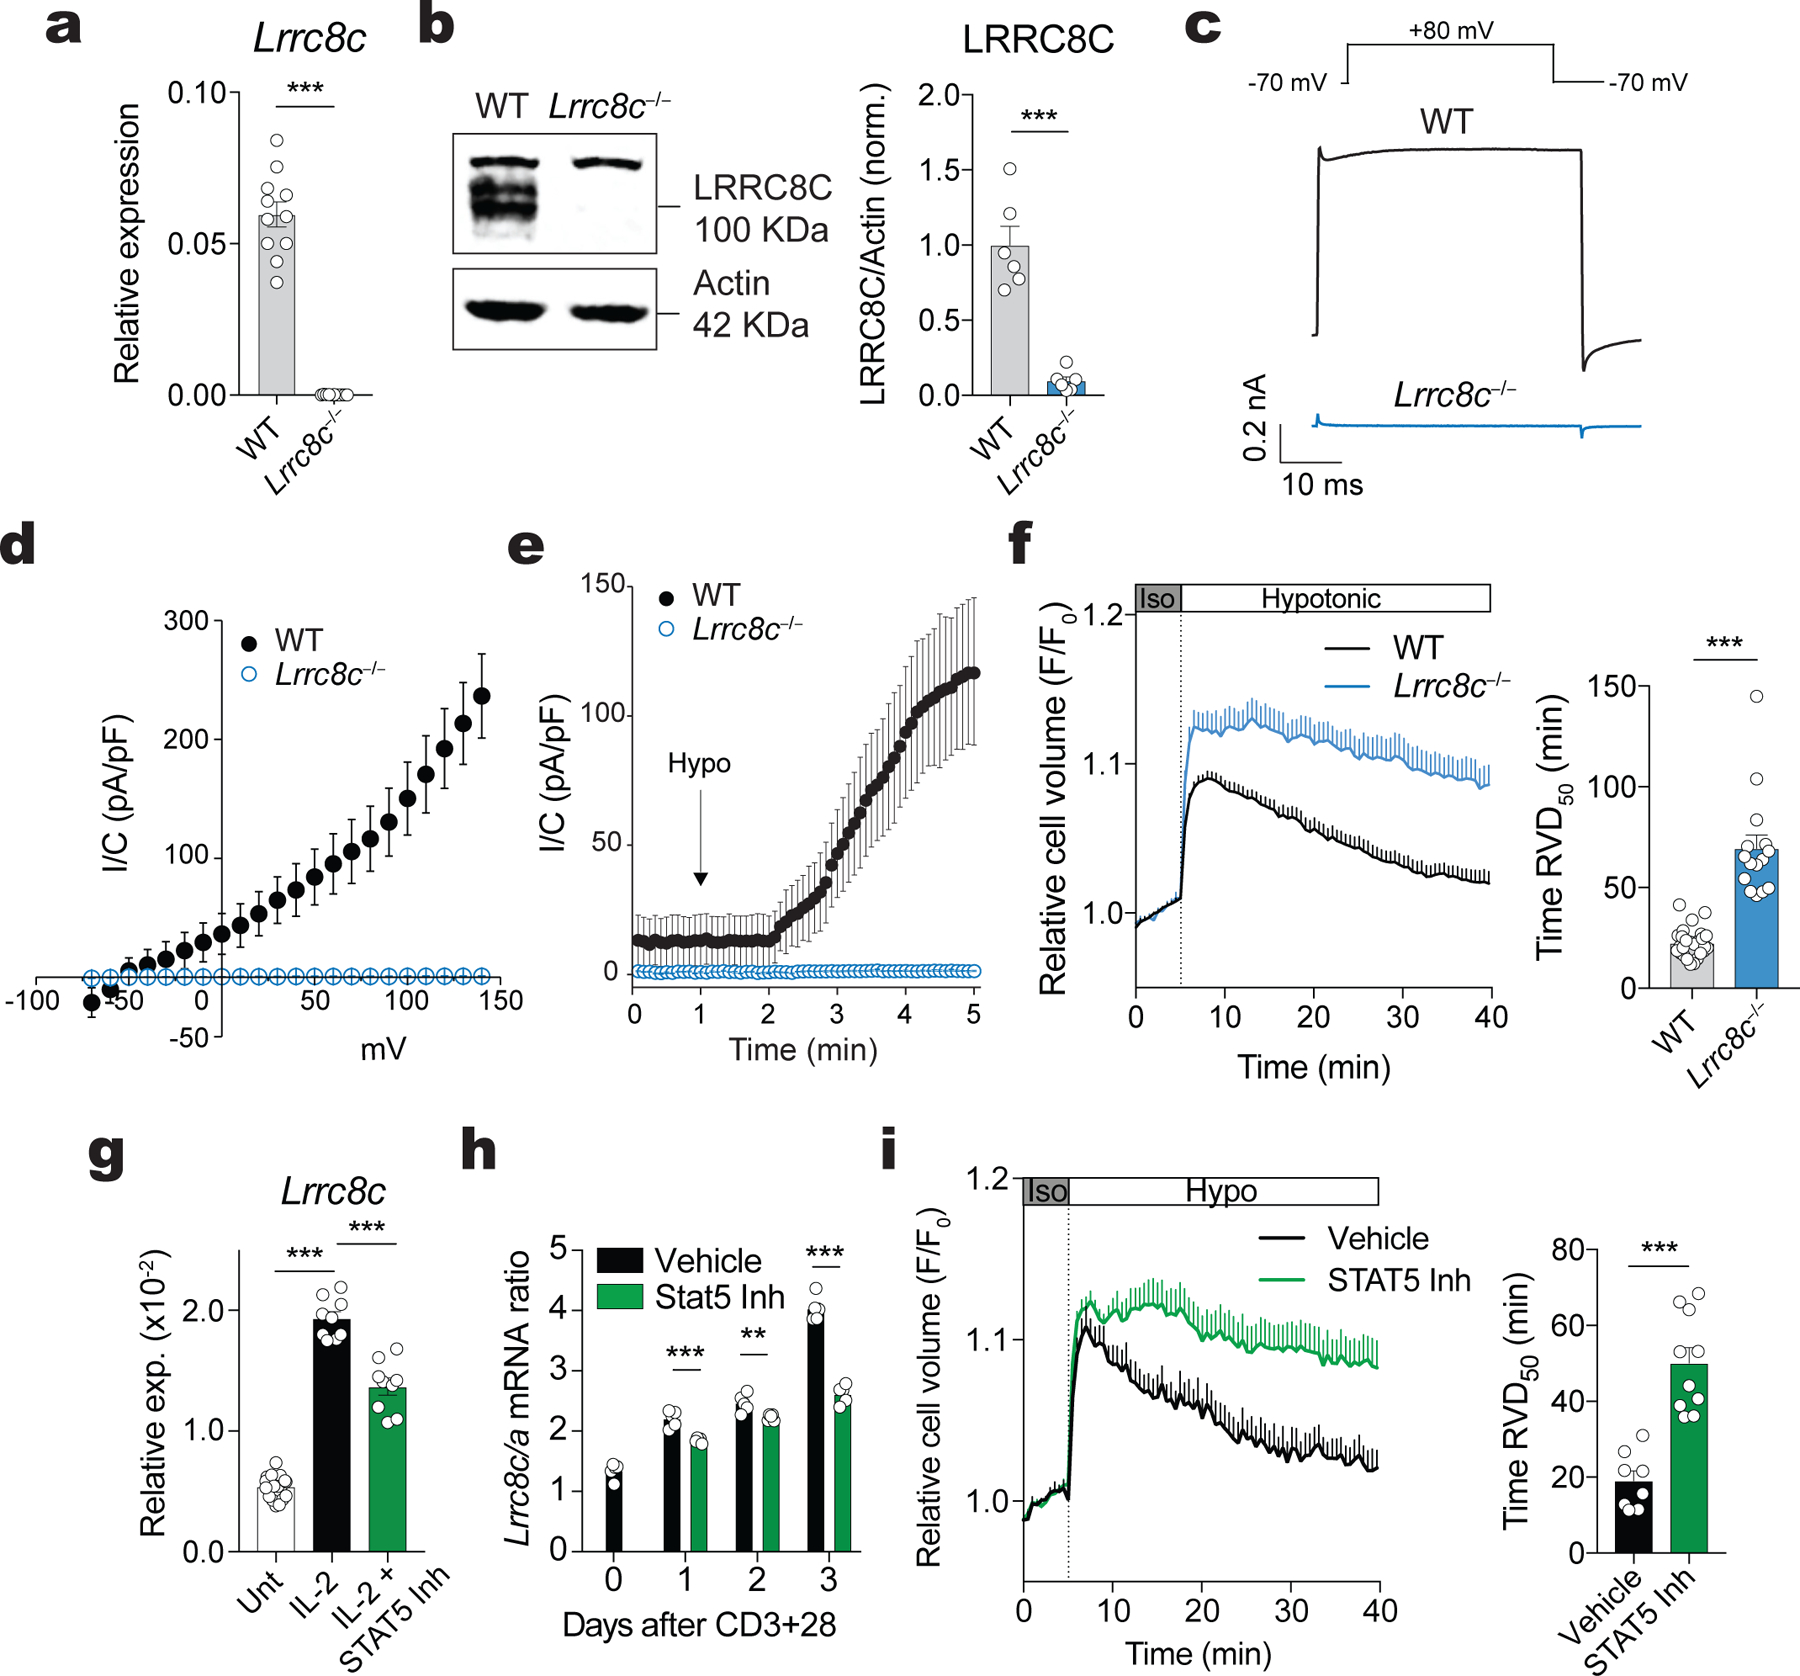
Figure 2. LRRC8C is an essential component of the VRAC channel in T cells.

(a) Expression of Lrrc8c (exon 4) mRNA in unstimulated CD4+ T cells from wild-type and Lrrc8c−/− mice and measured by RT-qPCR (n=11 mice/genotype). Gapdh mRNA was used as housekeeping control. (b) Representative Western blot (left) and quantification of LRRC8C protein (right) in wild-type and Lrrc8c−/− CD4+ T cells (n=6 mice/genotype). Actin was used as loading control. (c) Representative volume-regulated anion current (IVRAC) traces from wild-type and Lrrc8c−/− CD4+ T cells stimulated with anti-CD3+CD28 and measured using whole-cell patch clamp recordings (n=10 wild-type and 33 Lrrc8c−/− T cells, 3 independent experiments). T cells were bathed in hypotonic solution (~215 mOsm) and held at −70 mV, followed by depolarization to +80mV every 5s. (d) Current density as a function of voltage at the end of each test pulse from experiments similar to that shown in (c). (e) Average current densities at −70 mV and +80 mV over time induced by hypotonic (Hypo) solution in wild-type and Lrrc8c−/− CD4+ T cells. Data in (d-e) are from 10 wild-type and 33 Lrrc8c−/− T cells from 3 independent experiments. (f) Cell volume measurements in wild-type and Lrrc8c−/− CD4+ T cells stimulated with anti-CD3+CD28 and challenged with hypotonic buffer (215 mOsm). Cell volume traces (left) are from 3 independent experiments and n=5 mice/genotype. The regulatory volume decrease (RVD) is quantified (right) as the time to reach half maximal cell volume (RVD50). (g) mRNA expression of Lrrc8c from activated CD4+ T cells and re-stimulated or not with 20 IU/ml IL-2 in the presence or absence of STAT5 inhibitor for 24h, and measured by RT-qPCR. Gapdh mRNA was used as housekeeping control (n=3 mice/treatment, done in triplicates and pooled from 3 independent experiments). (h) Lrrc8c/Lrrc8a mRNA expression ratio in CD4+ T cells stimulated with anti-CD3+CD28 in the presence or absence of STAT5 inhibitor (n=5 mice and 3 independent experiments). (i) RVD measurements (left) and quantification of RVD50 (right) in CD4+ T cells stimulated with anti-CD3+CD28 with and without STAT5 inhibitor as described in (f). Each dot represents one trace pooled from 5 mice and 3 independent experiments. All data are mean ± s.e.m. and were analyzed by two-tailed, unpaired Student’s t test. **P < 0.01 and ***P < 0.001.
