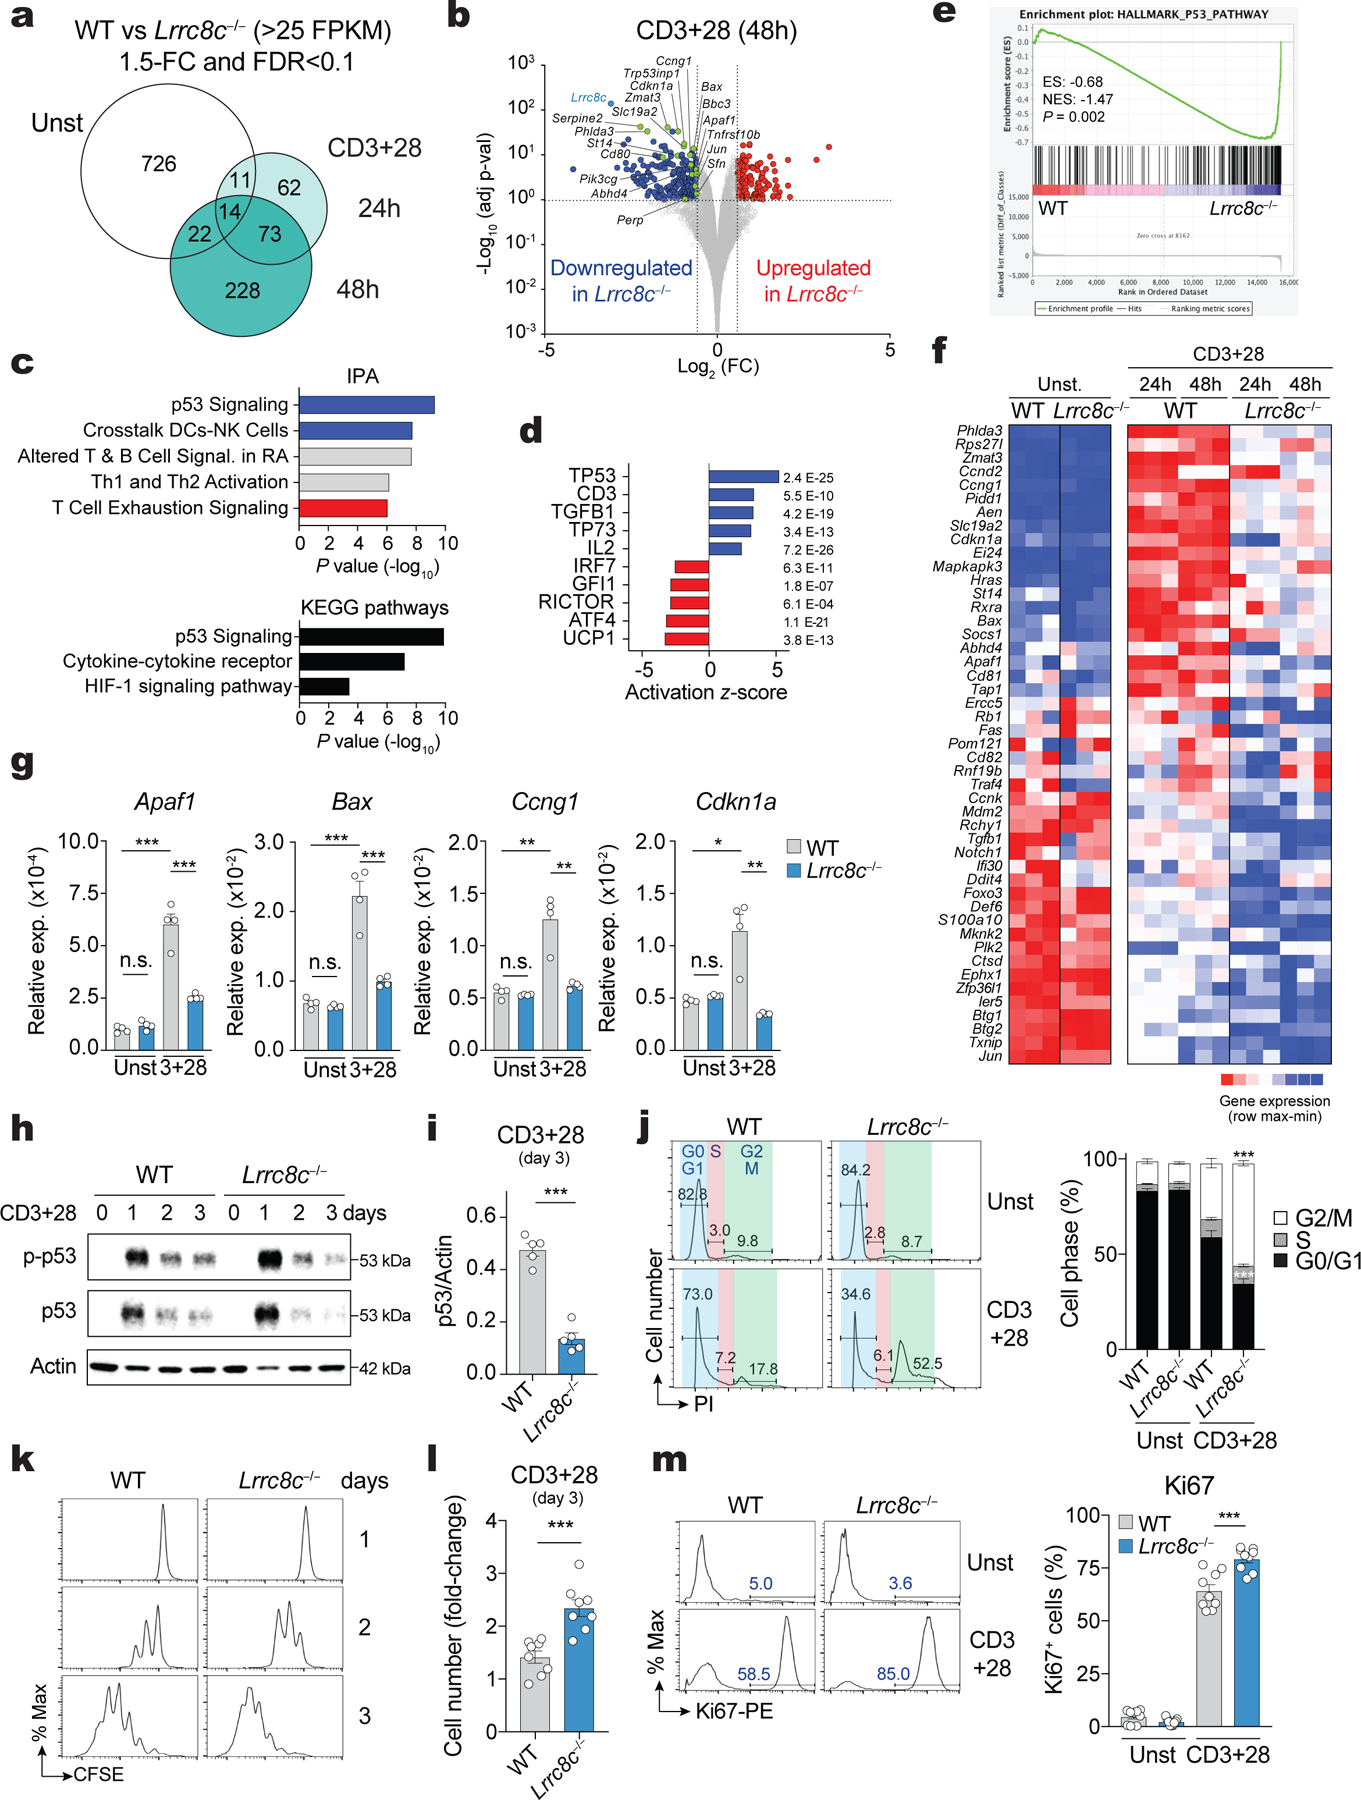
Figure 3. LRRC8C regulates p53 expression in T cells.

(a) Differentially expressed genes (DEG) between wild-type and Lrrc8c−/− CD4+ T cells before and after anti-CD3+CD28 stimulation and analyzed by RNA-seq. (b) Scatterplot of fold-change in gene expression (log2 FC) vs. adjusted p-value (−Log10) between wild-type and Lrrc8c−/− CD4+ T cells after anti-CD3+CD28 stimulation. Blue and red dots indicate downregulated and upregulated genes in Lrrc8c−/− T cells, respectively. Green dots indicate DEGs belonging to the p53 pathway. (c) IPA and KEGG pathways of DEGs in stimulated Lrrc8c−/− CD4+ T cells and ranked by P-value. (d) Top-5 upstream regulators that are inhibited (blue) or activated (red) in Lrrc8c−/− compared to wild-type CD4+ T cells after anti-CD3+CD28 stimulation and ranked by activation z-score. (e) GSEA showing enrichment in p53 pathway genes comparing transcriptomes of Lrrc8c−/− and wild-type CD4+ T cells after anti-CD3+CD28 stimulation. (f) Heat map of DEGs associated with the p53 pathway identified by GSEA in (e). Relative mRNA expression/row (red, high; blue, low). (g) mRNA expression of proapoptotic and cell cycle arrest genes in wild-type and Lrrc8c−/− CD4+ T cells before and after stimulation with anti-CD3+CD28 and measured by RT-qPCR. Rlp32 mRNA was used as housekeeping control (n=4 mice per genotype). (h) Immunoblot of total and phosphorylated p53 (p-p53 S15) in wild-type and Lrrc8c−/− CD4+ T cells before and after stimulation with anti-CD3+CD28. Actin was used as loading control. (i) Quantification of p53 expression in wild-type and Lrrc8c−/− CD4+ T cells stimulated for 3 days and normalized to actin loading control. Data are representative (h) and averaged (i) from n=5 mice/genotype and pooled from 2 independent experiments. (j) Cell cycle analysis of wild-type and Lrrc8c−/− CD4+ T cells before and after stimulation with anti-CD3+CD28. Representative flow cytometry plots (left) and quantification (right) of different cell cycle phases (n=6 and 8 mice/genotype for unstimulated and stimulated conditions, respectively). (k) CFSE dilution in wild-type and Lrrc8c−/− CD4+ T cells stimulated with anti-CD3+CD28. (l) Fold-change of CD4+ T cell numbers from (k) 3 days after anti-CD3+CD28 stimulation (compared to day 1, n=8 mice/genotype). (m) Ki67 expression in wild-type and Lrrc8c−/− CD4+ T cells before and after stimulation with anti-CD3+CD28. Representative flow cytometry plots (left) and quantification (right) of Ki67+ cells (n=9 mice/genotype, pooled from 3 independent experiments). All data are mean ± s.e.m. and were analyzed by two-tailed, unpaired Student’s t test. *P < 0.05, **P < 0.01 and ***P < 0.001.
