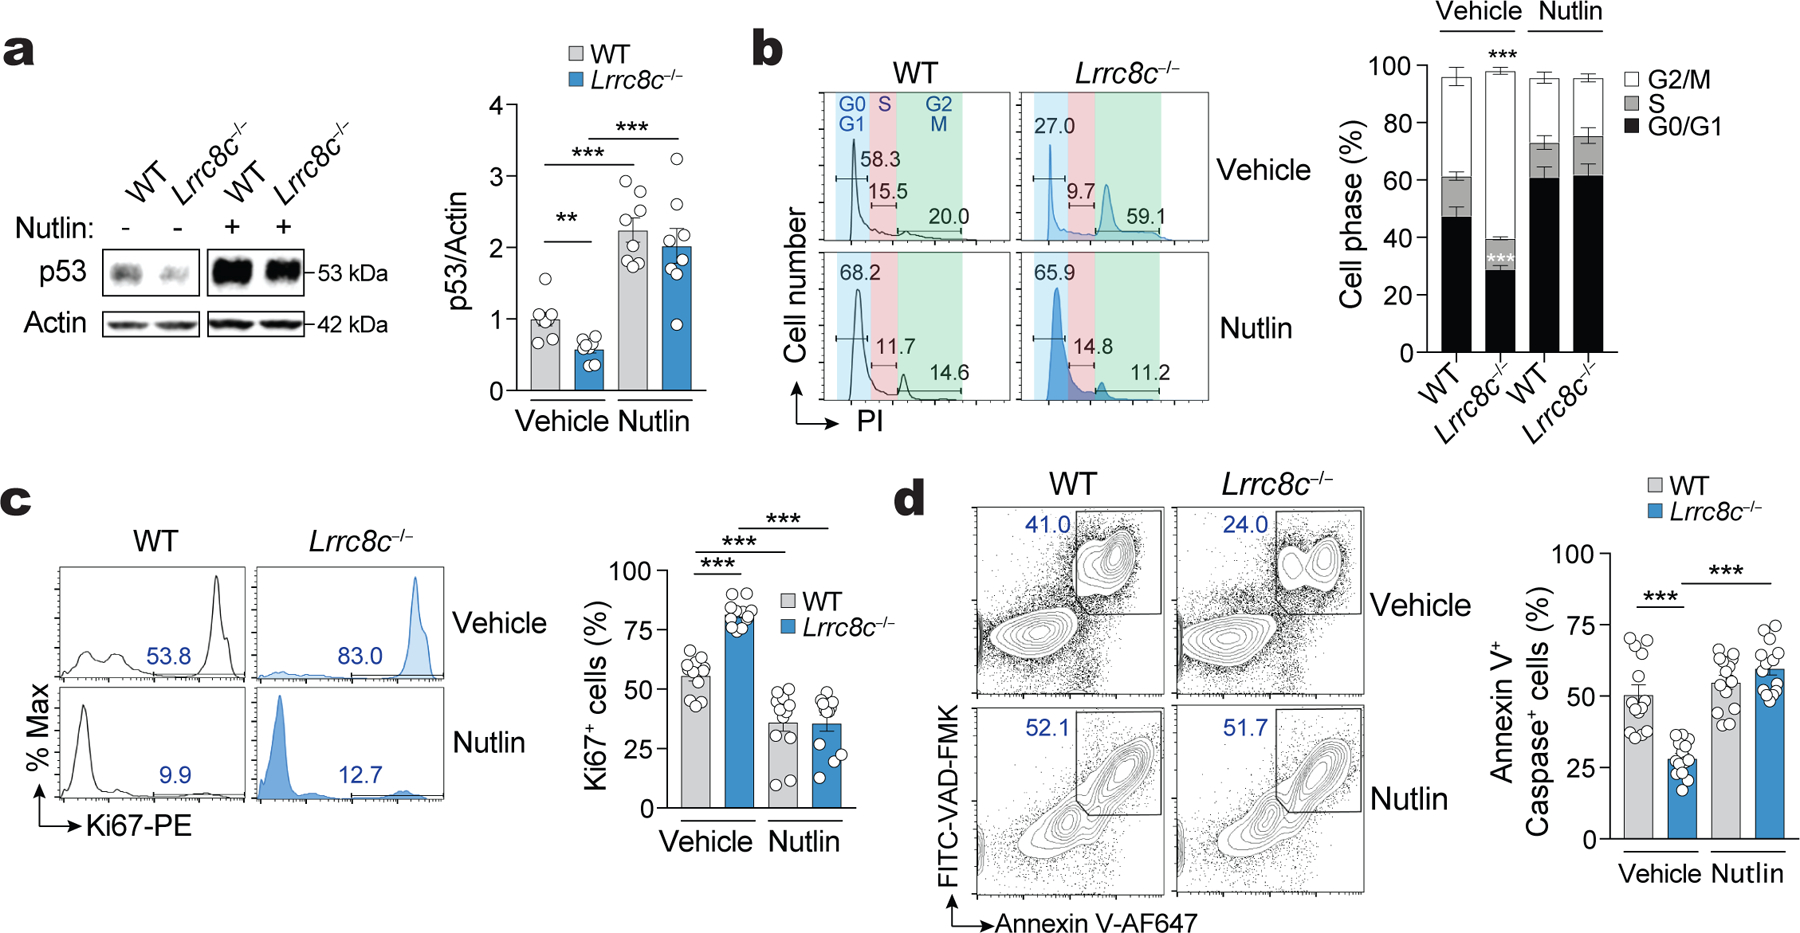
Figure 4. LRRC8C regulates T cell function through p53.

(a) Immunoblots of total p53 expression in wild-type and Lrrc8c−/− CD4+ T cells after stimulation with anti-CD3+CD28 for 3 days in the presence and absence of the MDM2 antagonist idasanutlin (abbreviated as nutlin). Actin was used as loading control. Representative blots (left) and quantification (right) from 4 independent experiments and 8 mice per genotype and treatment. (b) Cell cycle analysis of wild-type and Lrrc8c−/− CD4+ T cells after stimulation for 3 days in the presence or absence of nutlin. Representative flow cytometry plots (lefts) and quantification (right) of the different cell cycle phases. Data are from 12 mice per genotype and treatment, and pooled from 5 independent experiments. (c) Ki67 expression in wild-type and Lrrc8c−/− CD4+ T cells stimulated for 3 days and treated or not with nutlin. Representative flow cytometry plots (left) and quantification (right) of Ki67+ cells from 12 mice per genotype pooled from 5 independent experiments. (d) Apoptotic T cells from wild-type and Lrrc8c−/− mice measured by annexin V and active caspase (VAD-FMK) staining 3 days after stimulation and treated or not with nutlin. Representative contour plots (left) and quantification (right) of apoptotic cells from 14 mice per genotype pooled from 5 independent experiments. All data are mean ± s.e.m. and were analyzed by two-tailed, unpaired Student’s t test. **P < 0.01 and ***P < 0.001.
