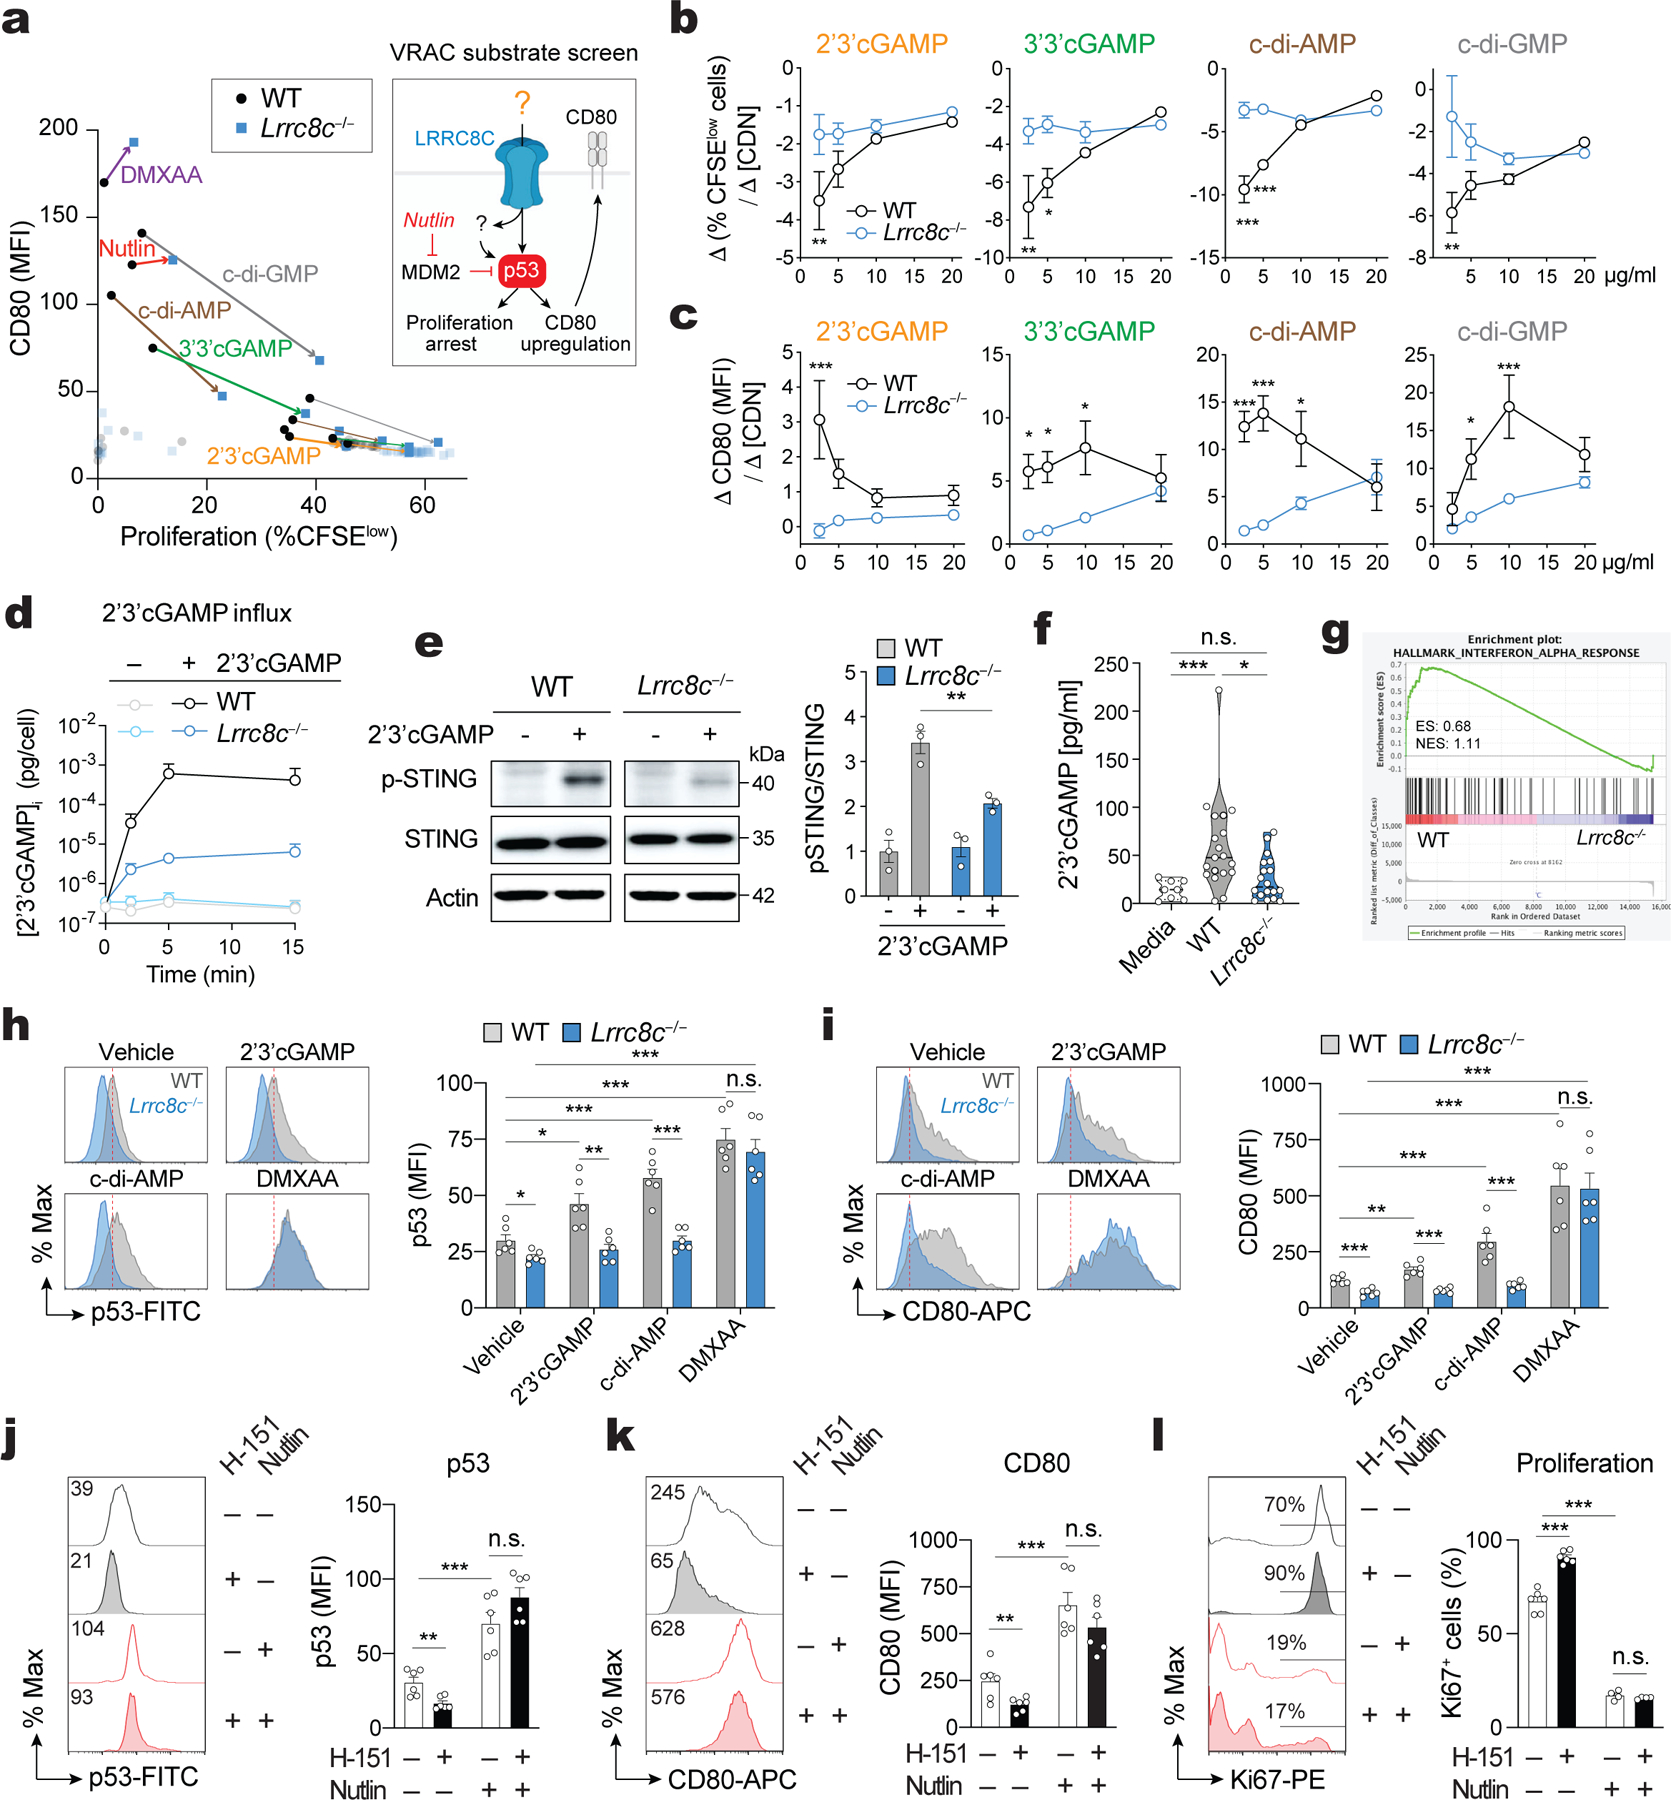
Figure 5. LRRC8C mediates cyclic dinucleotide transport, STING activation and p53 signaling.

(a) Compound screening to identify substrates of LRRC8C in T cells (Created with BioRender.com). Correlation of CD80 expression and CFSE dilution in wild-type and Lrrc8c−/− CD4+ T cells stimulated for 2 days with anti-CD3/CD28 and treated with different substrates of VRAC channels. Arrows connect wild-type and Lrrc8c−/− T cell samples treated with the same compound at high (thick line) and low (thin line) compound concentrations (n= 4 mice/ genotype, pooled from 2 independent experiments). (b,c) Wild-type and Lrrc8c−/− CD4+ T cells stimulated with anti-CD3/CD28 were treated with increasing concentrations of CDNs and analyzed for cell proliferation and CD80 expression. Graphs show the differences in proliferation (Δ%CFSElow cells, in b) and the differences in CD80 expression (DMFI, in c) between at least three CDN concentrations (Δ[CDN]). Compare with Extended Data Fig. 7c,d (n=6 mice/genotype and treatment, pooled from 3 independent experiments). (d) Intracellular concentration of cGAMP in T cells exposed or not to 5 μg/ml 2’3’cGAMP in hypotonic buffer (~215 mOsm) for 15 min and measured by ELISA (n=10 mice/genotype, pooled from 2 independent experiments). (e) Immunoblots of total and phosphorylated STING (p-STING S366) in wild-type and Lrrc8c−/− CD4+ T cells after treatment with 10 μg/ml 2’3’cGAMP for 6h. Actin was used as loading control. Representative blots (left) and quantification (right) from n=3 mice/genotype and 2 independent experiments. (f) 2’3’cGAMP amount in culture media collected after in vitro stimulation of CD4+ T cells with anti-CD3+CD28 for 1–3 days measured by ELISA (n=6 mice/genotype, pooled from 5 independent experiments). (g) GSEA of RNA-Seq data identifies DEGs associated with IFN-α response in stimulated wild-type but not Lrrc8c−/− CD4+ T cells. (h,i) Flow cytometry analysis of p53 (h) and CD80 expression (i) in wild-type and Lrrc8c−/− CD4+ T cells stimulated with anti-CD3+CD28 and treated or not with STING agonists. Representative flow cytometry plots (left) and quantification (right). Data are from n=6 mice/genotype, pooled from 3 independent experiments. (j-l) Flow cytometry analysis of p53 (j), CD80 (k), and Ki67 (l) expression in wild-type CD4+ T cells stimulated for 3 days with anti-CD3+CD28 and treated or not with H-151 and idasanutlin (nutlin). Representative flow cytometry plots (left) and quantification (right) from n=6 mice/treatment, pooled from 3 independent experiments. All data are mean ± s.e.m. and were analyzed by two-tailed, unpaired Student’s t test. *P < 0.05, **P < 0.01 and ***P < 0.001.
