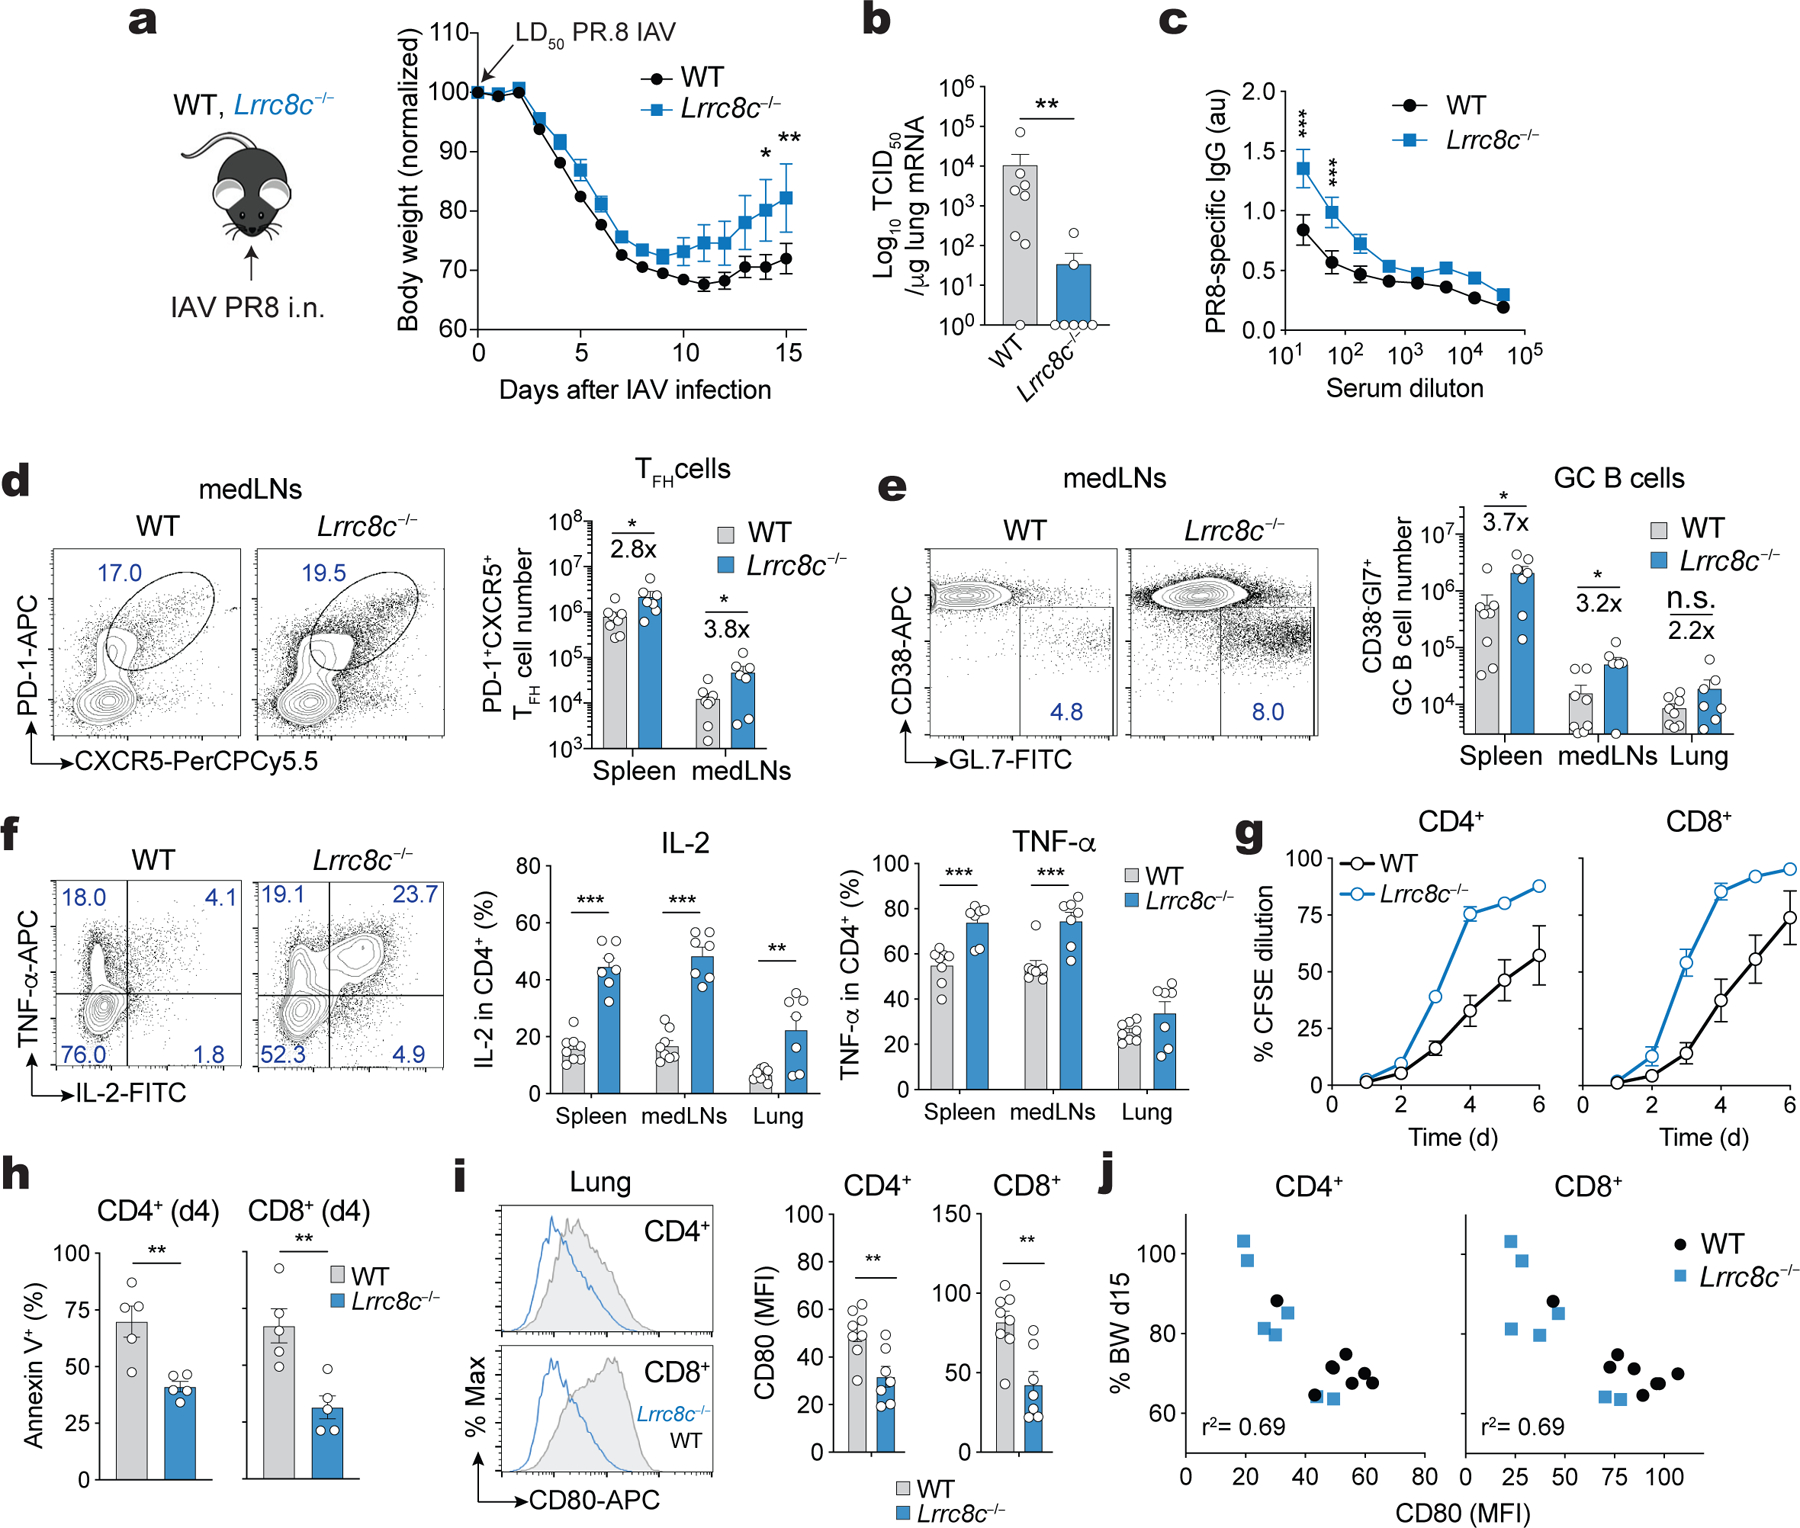
Figure 8. LRRC8C deficiency enhances T cell mediated antiviral immunity to influenza.

(a) Experimental design of influenza A virus (IAV) infection of wild-type and Lrrc8c−/− mice using the PR8 strain (H1N1, left), and body weight change (right) relative to the initial weight before infection. i.n., intranasal; LD, lethal dose. (b) Viral titers detected in the lung of IAV infected mice by measuring PR8 M2/M1 mRNA expression using RT-qPCR. TCID50, 50% tissue culture infective dose. TCID50 values where transform to TCID50+1 to plot titers on log10 scale. (c) anti-PR8 IgG antibodies in the sera of wild-type and Lrrc8c−/− mice detected by ELISA. (d) Representative flow cytometry plots and bar graphs showing the frequencies of T follicular helper (TFH) cells in the mediastinal lymph nodes (medLNs, left) and absolute number of TFH cells in spleen and medLNs (right). (e) Representative contour plots and bar graphs showing the frequencies of germinal center (GC) B cells in the medLNs (left) and absolute numbers of GC B cells in the spleen, medLNs and lungs (right). (f) Expression of IL-2 and TNF-α in CD4+ T cells isolated from IAV infected mice. Representative contour plots from lung-infiltrating T cells (left) and frequencies (right) of cytokine-producing T cells isolated from the spleen, medLNs and lungs after PMA+Iono re-stimulation for 6h. (g) T cell proliferation measured by CFSE dilution in wild-type and Lrrc8c−/− CD4+ T cells isolated from the lung of mice infected with IAV and re-stimulated with anti-CD3+CD28. (h) Apoptosis of CD4+ and CD8+ T cells from wild-type and Lrrc8c−/− mice shown in (g) measured by annexin V staining 4 days after stimulation with anti-CD3+CD28. (i) CD80 surface expression by CD4+ and CD8+ T cells in the lungs of wild-type and Lrrc8c−/− mice infected with IAV. Representative histogram plots (left) and quantification (right) of CD80 expression (MFI). (j) Correlation of CD80 expression by T cells in the lungs of IAV infected mice vs. body weight (% original BW of mice 15 days after IAV infection). Data in (a-j) are pooled from 2 independent experiments using 8 wild-type and 7 Lrrc8c−/− mice. Data in (g,h) are pooled from 2 independent experiments using 5 mice/genotype. All data are mean ± s.e.m. and were analyzed by 2-way ANOVA with Sidak’s multiple comparison test (a), two-tailed Mann Whitney test (b), and two-tailed, unpaired Student’s t test (b-f, h,i), *P < 0.05, **P < 0.01, ***P < 0.001.
