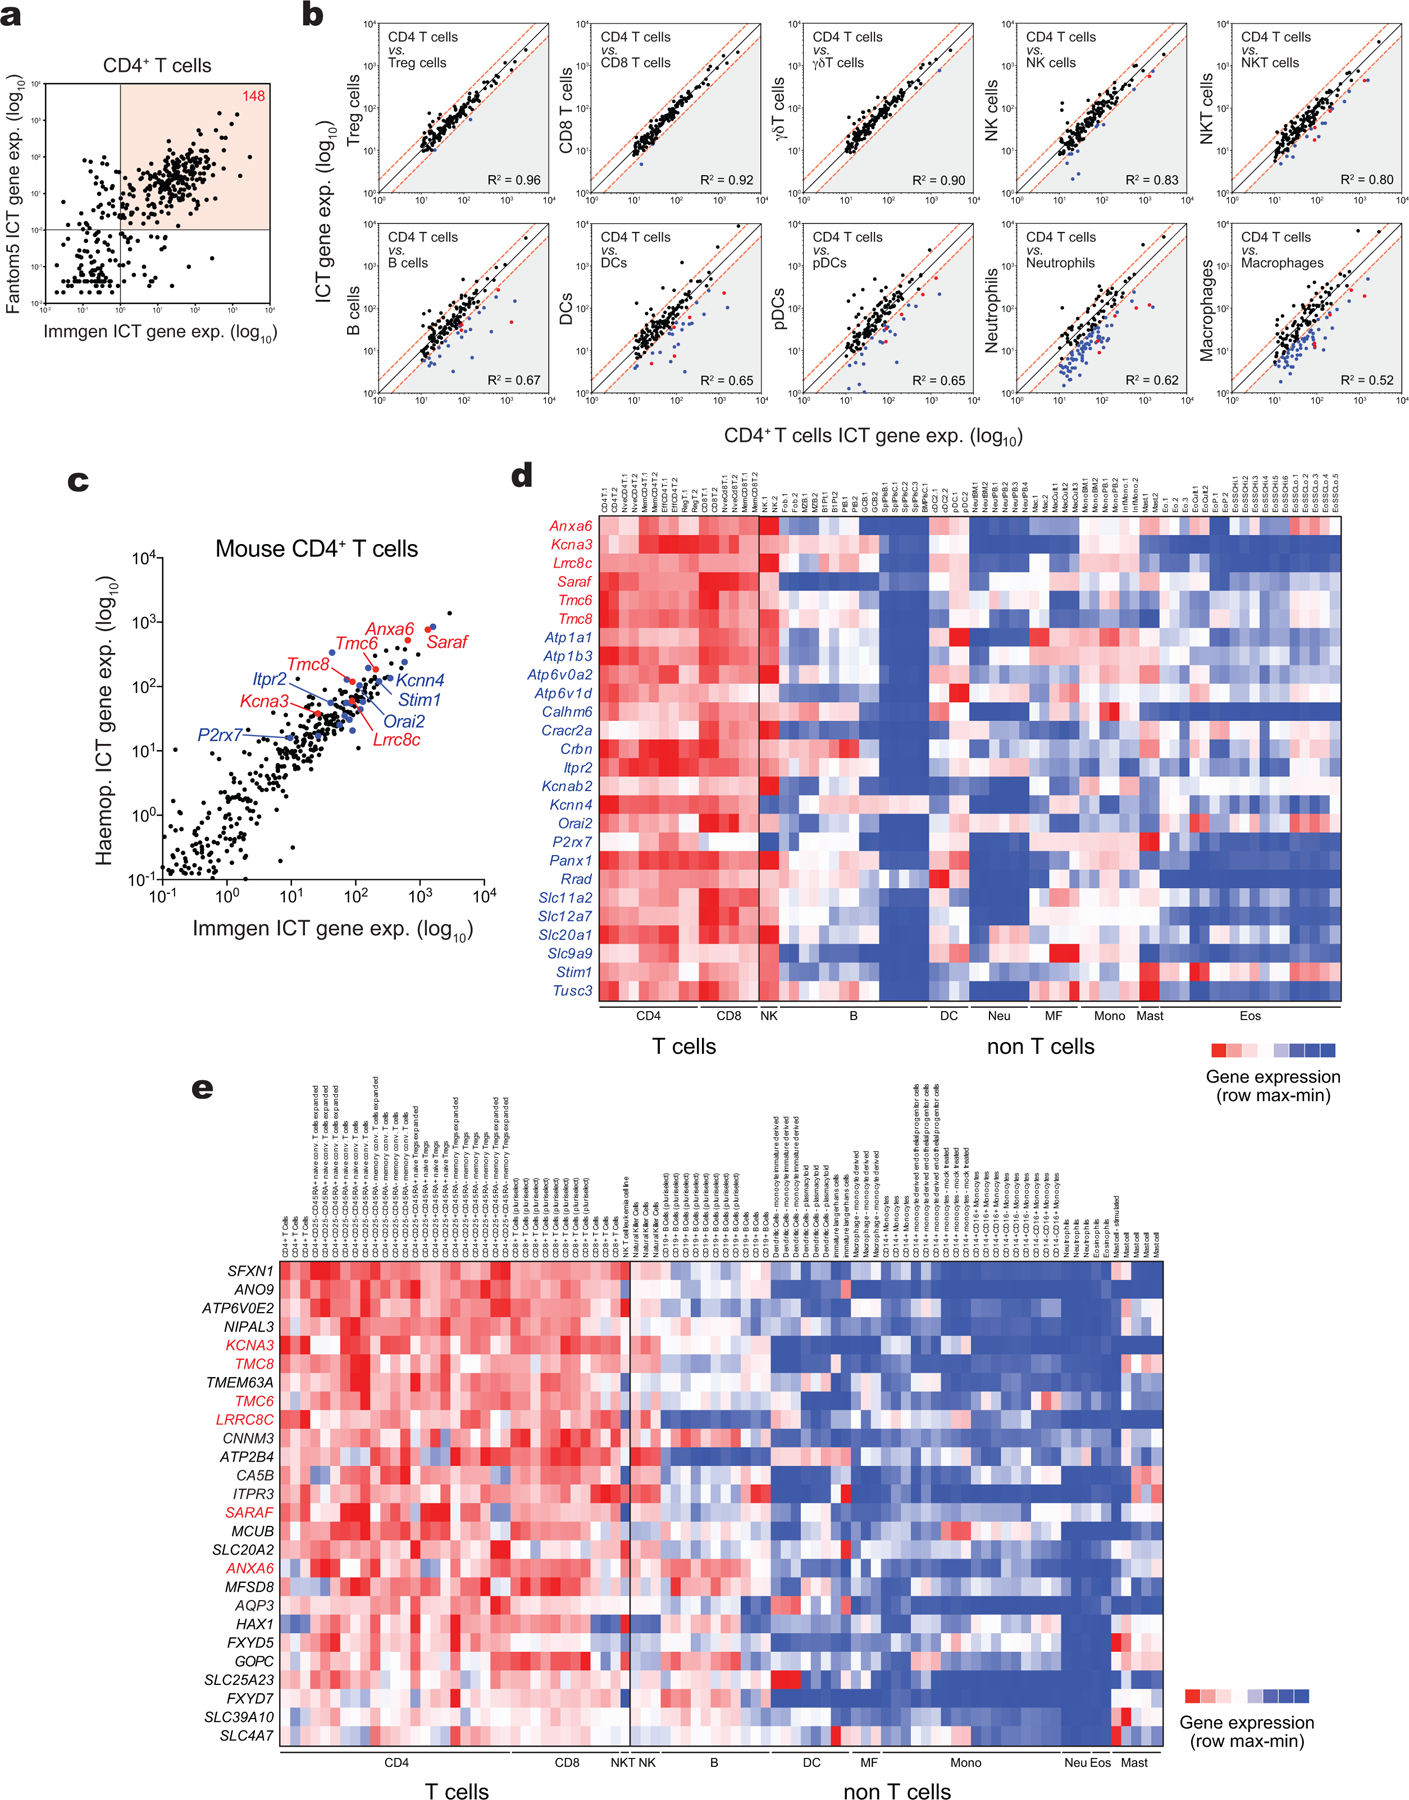
Extended Data Figure 1. Transcriptomic analysis of the ion channelome in immune cells identifies LRRC8C and other specific ICTs in T cells.

(a) Correlation analysis of ICT genes in CD4+ T cells from mouse ImmGen RNA-Seq and human Fantom5 CAGE-Seq databases. 148 ICTs are highly expressed in both human and mouse T cells (red quadrant). (b) Correlation analysis of 148 highly expressed ICT genes in CD4+ T cells and other immune cells from mouse ImmGen RNA-Seq. ICT genes on the bottom right (grey triangle) are 2-fold higher expressed in CD4+ T cells compared to other immune cells. CD4-specific ICT genes highlighted in blue are shared in both mouse ImmGen and Haemopedia datasets, and red are shared in ImmGen, Haemopedia, and human Fantom5 datasets. (c) Correlation analysis of ICT genes in mouse CD4+ T cells from ImmGen RNA-Seq and Haemopedia RNA-Seq databases. Most specific ICTs are highlighted in red and known ICTs to play a role in T cells shared in both mouse ImmGen and Haemopedia datasets are highlighted in blue. (d,e) Expression profile of differentially expressed ICTs in CD4+ T cells from (d) Haemopedia RNA-Seq and (e) Fantom5 CAGE-Seq databases. Color coding: high (red) and low (blue) relative mRNA expression per row.
