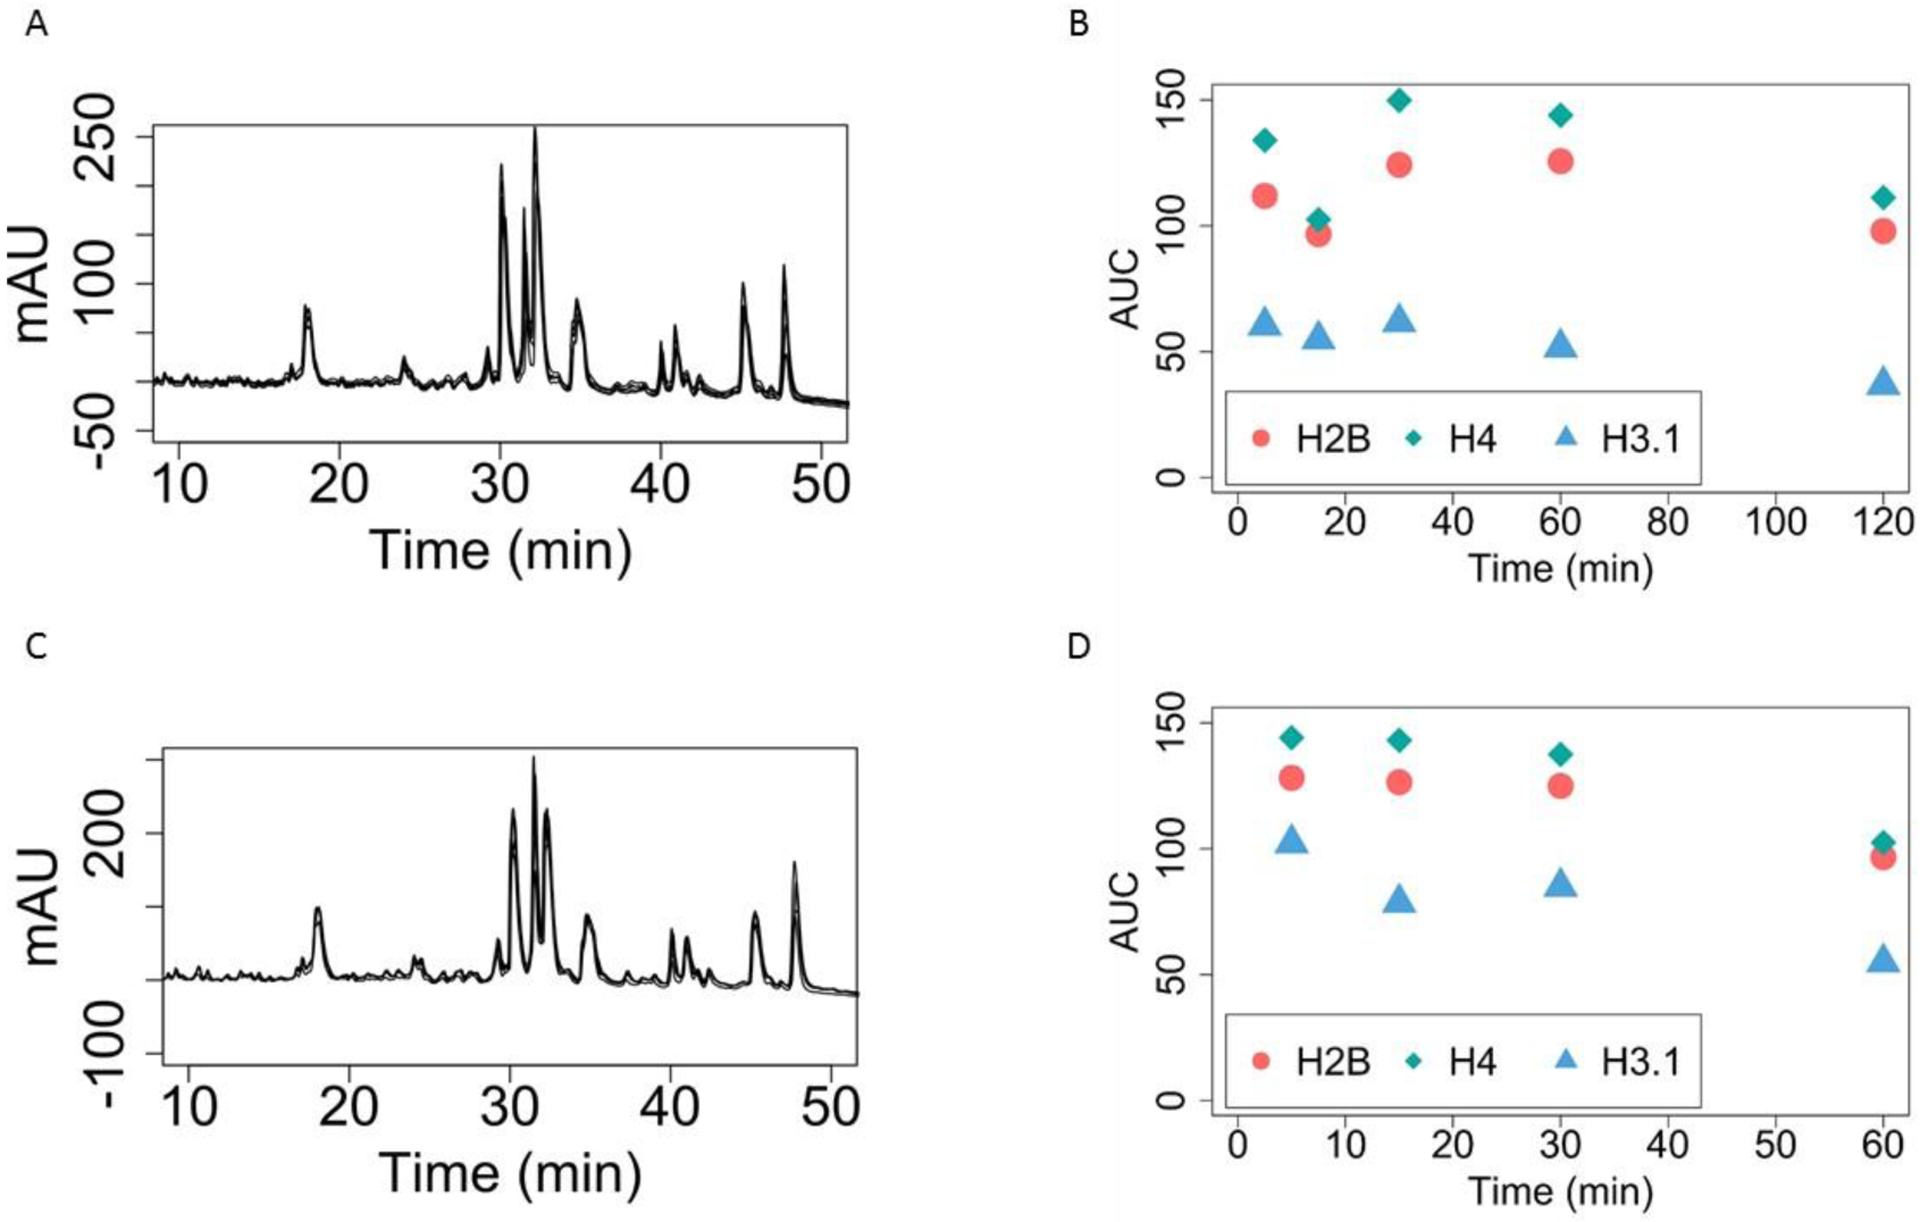
Figure 1. Five Minute HCl and TCA Precipitations are Sufficient
A) HPLC Chromatogram of SUM159 cell line histones with varying HCl precipitation times. Each black line represents a different HCl precipitation time: 5 min, 15min, 30min, 60 min and 120 min. Note that these are not readily distinguishable from each other and overlap almost perfectly. Thus, extensive HCl precipitations, such as overnight, are neither necessary nor beneficial.
B) Quantitation of Histones by area under the curve (AUC) with varying HCl precipitation times. The areas under the curve from Figure 1A are integrated for the different time points of HCl precipitation. There is no significant trend for increasing HCl times.
C) HPLC Chromatogram of SUM159 histones with varying TCA precipitation times. Each black line represents a different TCA precipitation time: 5 min, 15min, 30min and 60min. There is no difference in retention time or peak heights by increasing TCA precipitation time.
D) Quantitation of Histones by AUC with varying TCA precipitation times. The areas under the curve from Figure 1C are integrated for the different time points of TCA precipitation. There is no significant trend for increasing TCA times.
