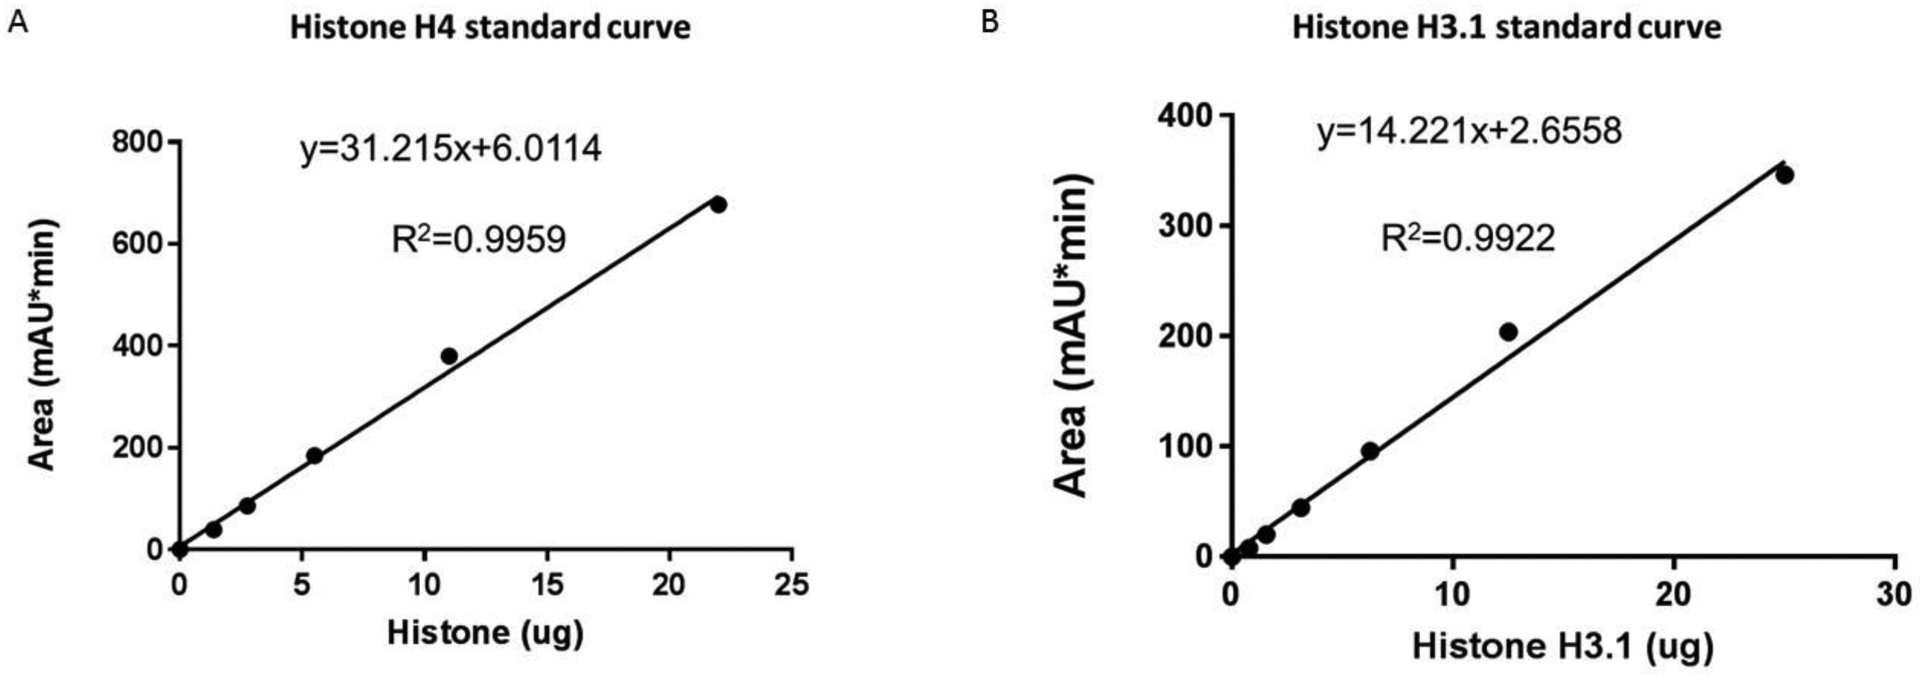
Figure 2 Histone H3 and H4 Standard Curves for Estimating Protein Amount
A) Histone H4 Standard Curve. Area of mAU obtained from HPLC analysis of purified histone H4.
B) Histone H3.1 Standard Curve. Area of mAU obtained from HPLC analysis of purified histone H3.1.
