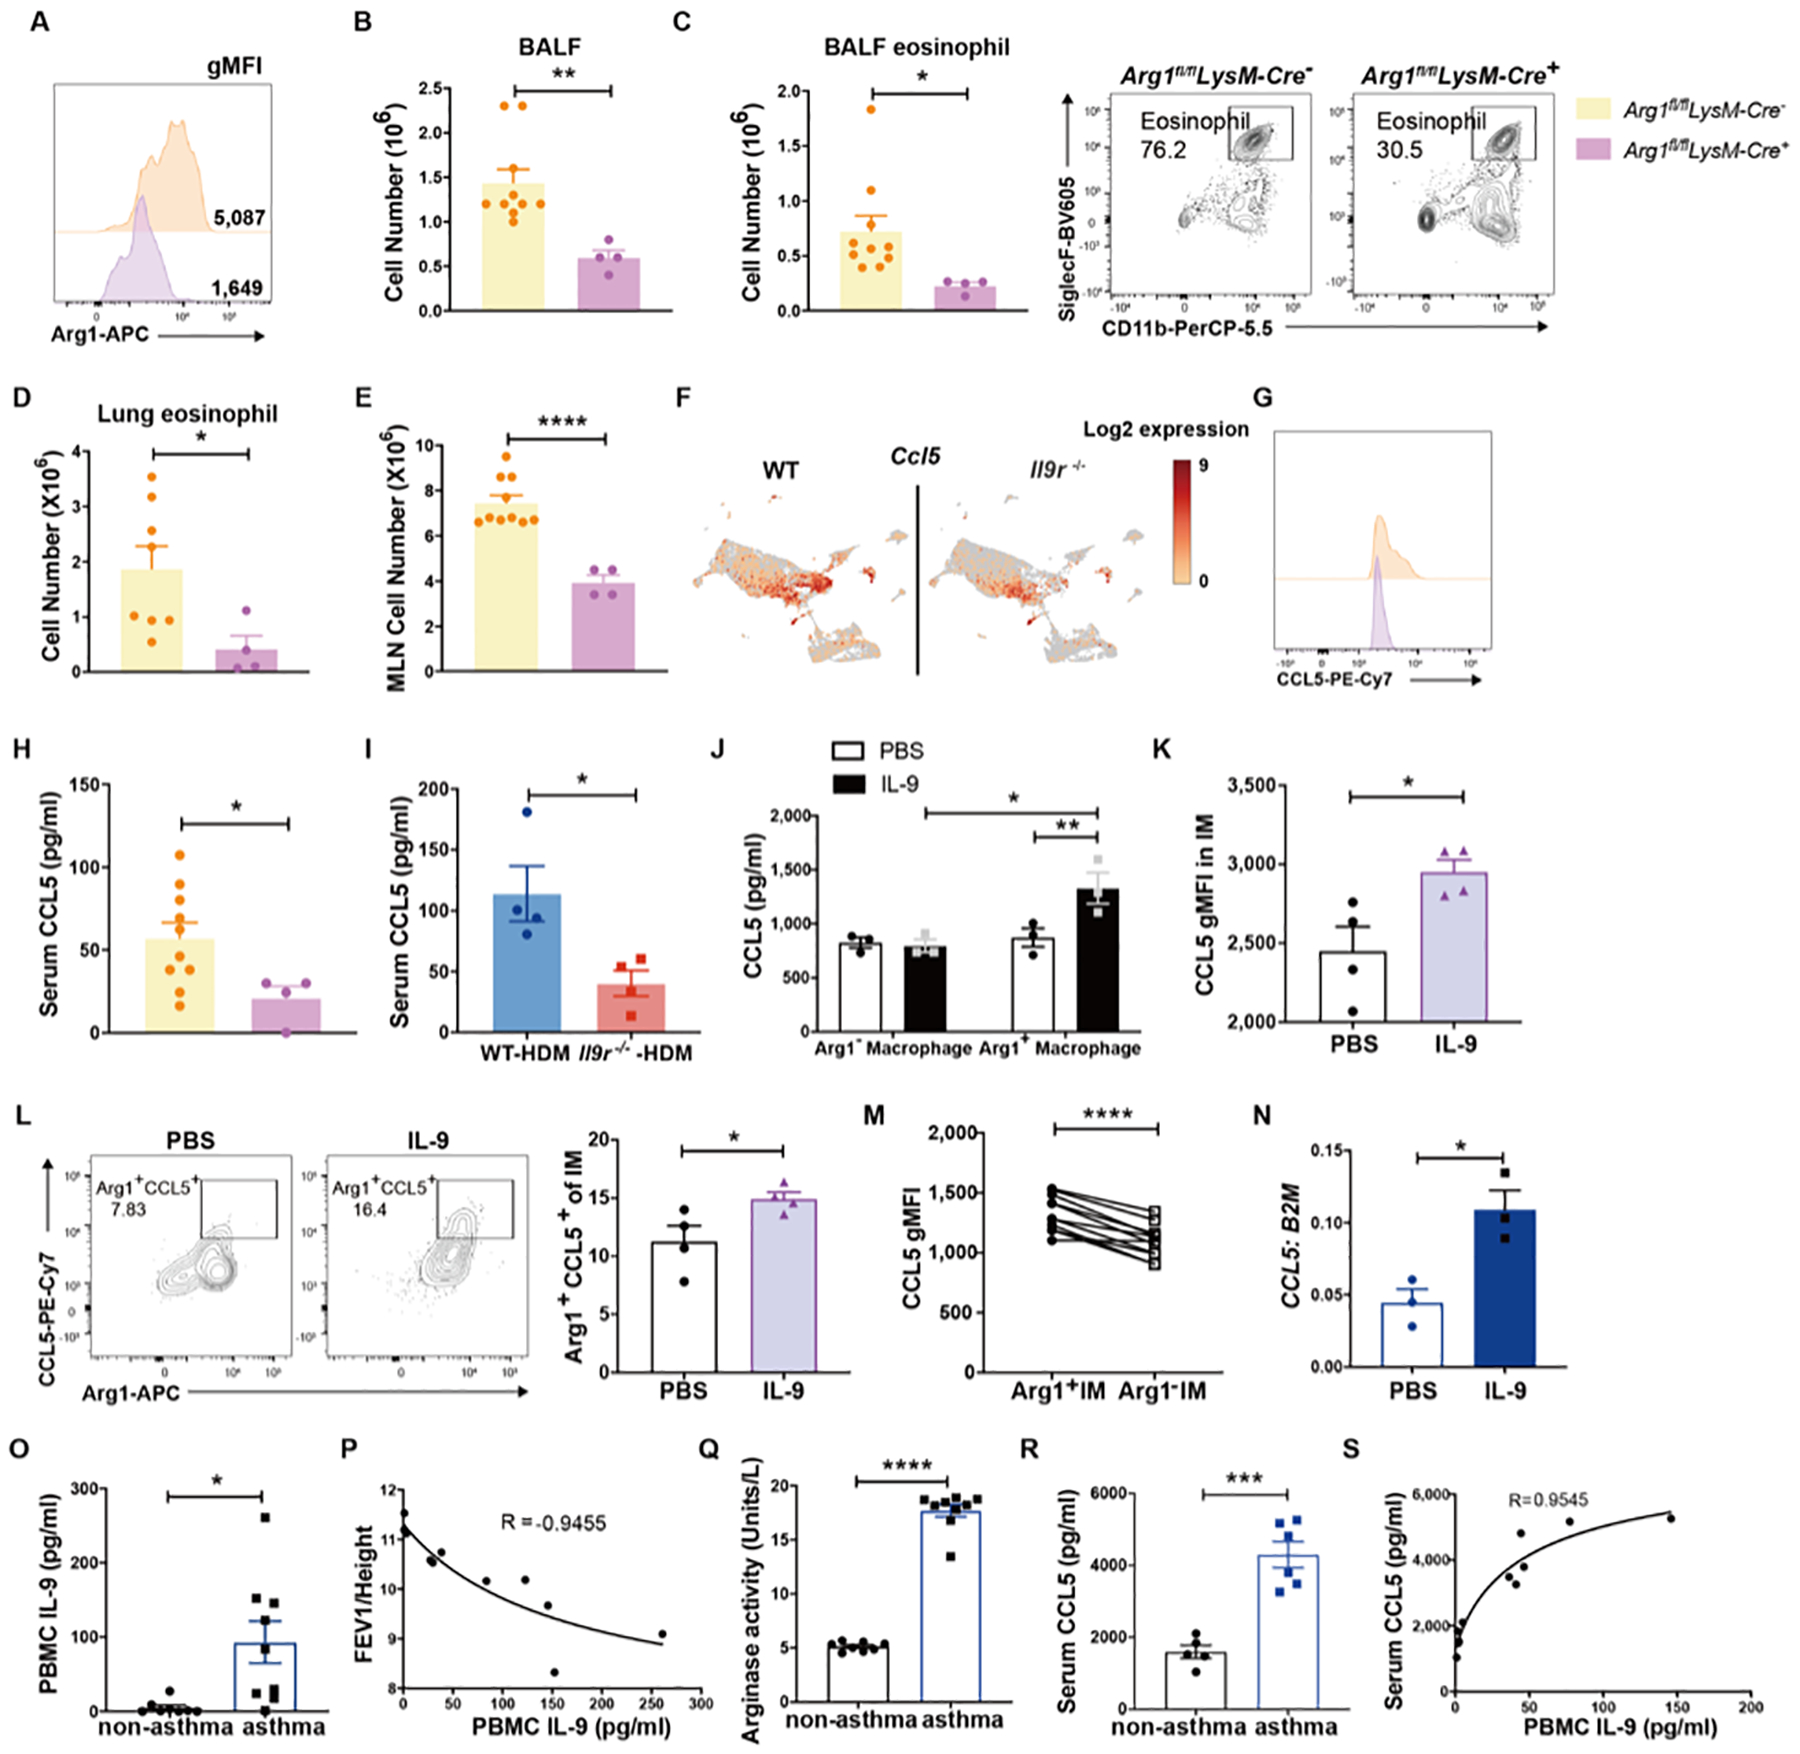
Fig. 7. IL-9 promotes allergic inflammation by inducing CCL5 production from lung macrophages.

Arg1fl/fl LysM-Cre+/− mice were treated with HDM for 6 weeks.
(A), Arg1 expression in IMs was analyzed. BALF total cell number (B), BALF eosinophils (C), Lung eosinophils (D) and MLN cell number were analyzed (n = 4–10).
(F), UMAP showing Ccl5 expression from CITE-seq experiment described in Fig. 3.
(G), CCL5 expression in IMs was analyzed by flow cytometry (n = 4–10).
(H and I), Serum CCL5 level was analyzed by ELISA (n = 4–10).
(J), FACS sorted Arg1+/− macrophages were treated with IL-9 for 24 hours, CCL5 level was measured by ELISA (n=3).
(K-L), Naïve mice were treated with IL-9 for three days, CCL5 and Arg1 expression from IMs were analyzed (n=4).
(M), CCL5 expression was analyzed by gating on Arg1+ or Arg1− IMs from WT HDM treated mice (n=11).
(N), Human monocyte were cultured under M2 macrophage condition, CCL5 mRNA expression was analyzed (n = 3).
(O), IL-9 production from PBMCs was analyzed from non-asthma donors and asthma patients (n=7–9).
(P), Correlation between FEV1 corrected for height and IL-9 production from patient PBMCs.
(Q-R), Arginase activity (Q) and CCL5 level (R) was analyzed from non-asthma donors and asthma patients (n=5–9).
(S), Correlation of PBMC IL-9 and serum CCL5 concentration (n=11).
Data are presented as mean ± SEM from two independent experiments. Unpaired two-tailed Student t-test was used for comparison in B–C, D–E, H–I, K–L, N–O and Q–R. A paired two-tailed t-test was used to generate the p value in M. Two-way ANOVA with Sidak’s multiple comparisons was used for comparisons in J. Spearman correlation was performed for P and S, *p<0.05, **p<0.01, ***p<0.001, ****p<0.0001. See also Fig. S6.
