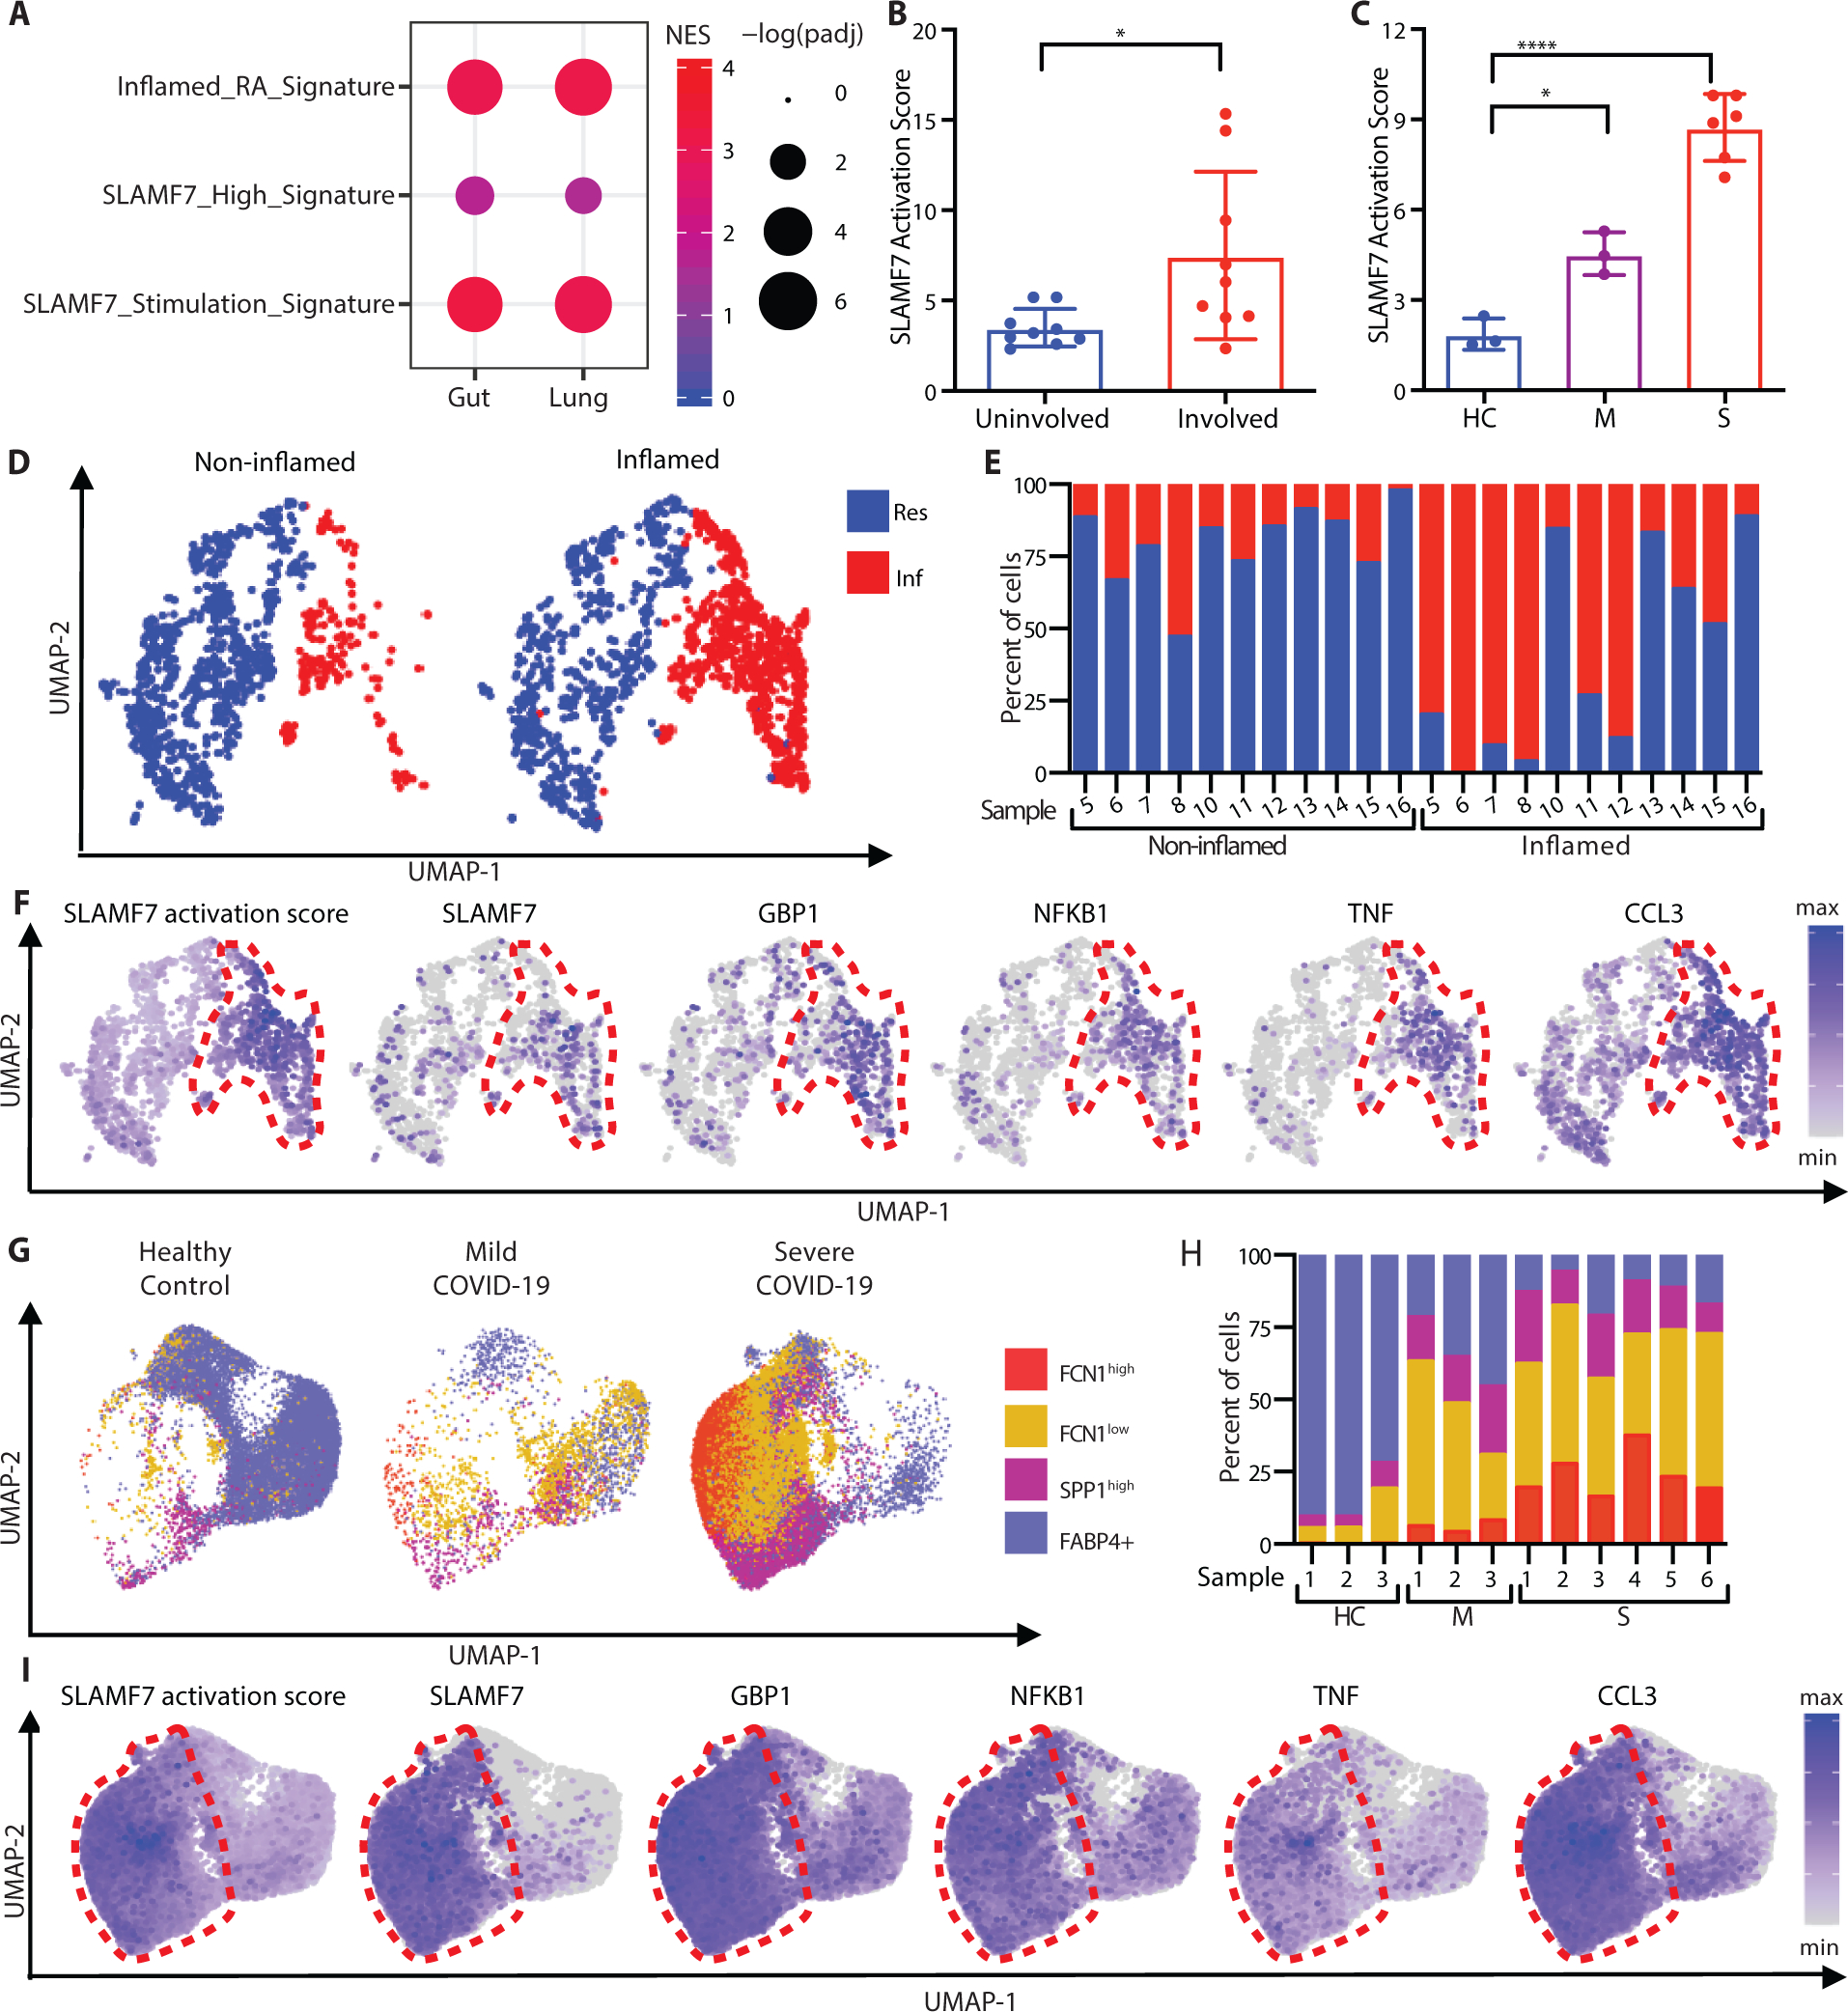
Figure 7. SLAMF7 super-activated macrophages drive inflammation in inflammatory bowel disease and COVID-19 infection.

A) Gene set enrichment analysis comparing gene expression from macrophages from inflamed ileal tissues in patients with Crohn’s disease or lungs of patients with severe COVID-19 with the “Inflamed RA Macrophage Signature”, the “SLAMF7-High Macrophage Signature” and the “Macrophage SLAMF7 Stimulation Signature.” B) SLAMF7 activation score for macrophages from non-inflamed (n=9) and inflamed ileal tissues (n=9) (8). C) SLAMF7 activation score for bronchoalveolar lavage macrophages from healthy controls (n=3), or individuals with mild (n=3) or severe COVID-19 (n=6) (20). Data in B-C represent mean ± SD. D) UMAP plot of macrophage clusters from involved and uninvolved ileal tissues. E) Percent of macrophages from each donor assigned to each cluster. F) UMAP plots showing gene expression of ileal macrophage populations. G) UMAP plot of bronchoalveolar lavage macrophage populations. H) Percent of macrophages from each donor assigned to each population. I) UMAP plots showing gene expression for bronchoalveolar lavage macrophage populations. The paired t-test was used to compare inflamed and non-inflamed gut tissues, and the one-way ANOVA with Dunnett’s multiple comparisons test was used to compare mild and severe COVID-19 to healthy controls. NES, normalized expression score; Res, Resident macrophage cluster; Inf, Inflammatory macrophage cluster; HC, healthy control; M, mild COVID-19; S, severe COVID-19; *, p ≤ 0.05; **, p ≤ 0.01; ****, p < 0.0001.
