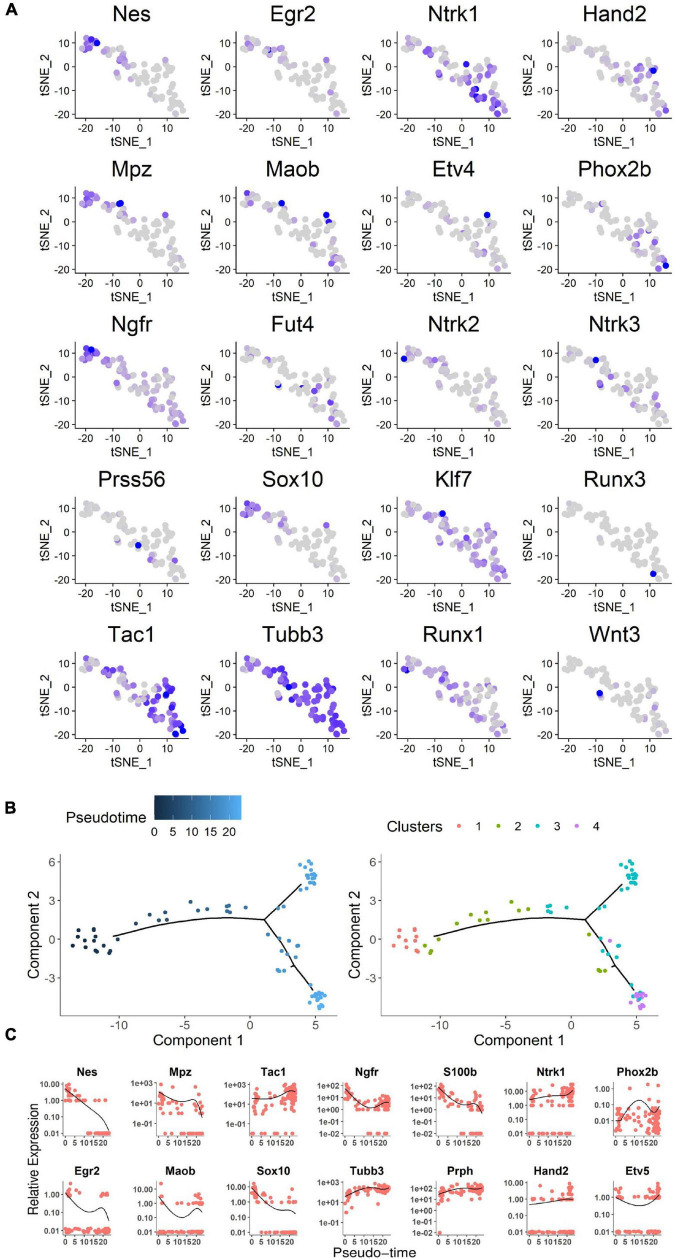
FIGURE 5.
Analysis of neuronal cell single-cell sequencing data. (A) Expression profile of neural crest differentiation-related genes in the t-SNE map. Blue gradient represented the level of gene expression. (B) Expression profile of representative genes along the pseudo-time. Cells were ordered on the x pseudo-time axis by development of neural stem cells. Relevant gene expression was shown on the y axis as transcript counts (the black line was the running mean of expression with a window size of all cells). Each dot represents a cell. As show on the right, cells are highlighted in the same subcluster color gradient as in Figure 4C. (C) The pseudo-time genes expression level based on expression gradient. The chosen genes were representative examples of pseudo-timed differential expression along the transition from proliferation to differentiation for neural crest stem cells, progenitors, and neurons. See also Supplementary Figure 1.

