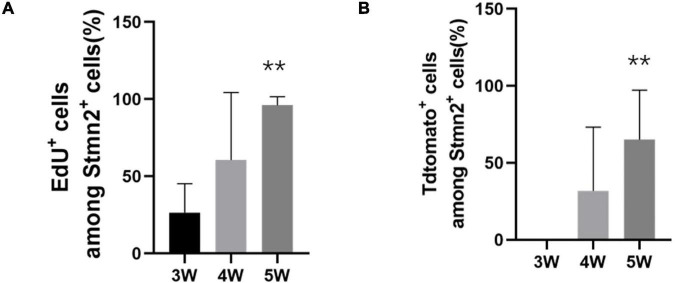
FIGURE 8.
The quantification of proliferation of the neuronal stem-like cells. (A) The quantification of the percentage of EdU+ cells among all Stmn2+ cells in the sciatic nerve. Values represent mean ± SEM (n = 5 sciatic nerves for each time point; **p < 0.05; one-way ANOVA with Dunnett’s multiple comparisons test). (B) Quantification of the proportion of TdTomato+ cells among all Stmn2+ cells in the sciatic nerve. Values represent mean ± SEM (n = 5 sciatic nerves for each time point; **p < 0.05; one-way ANOVA with Dunnett’s multiple comparisons test).

