Fig. 3.
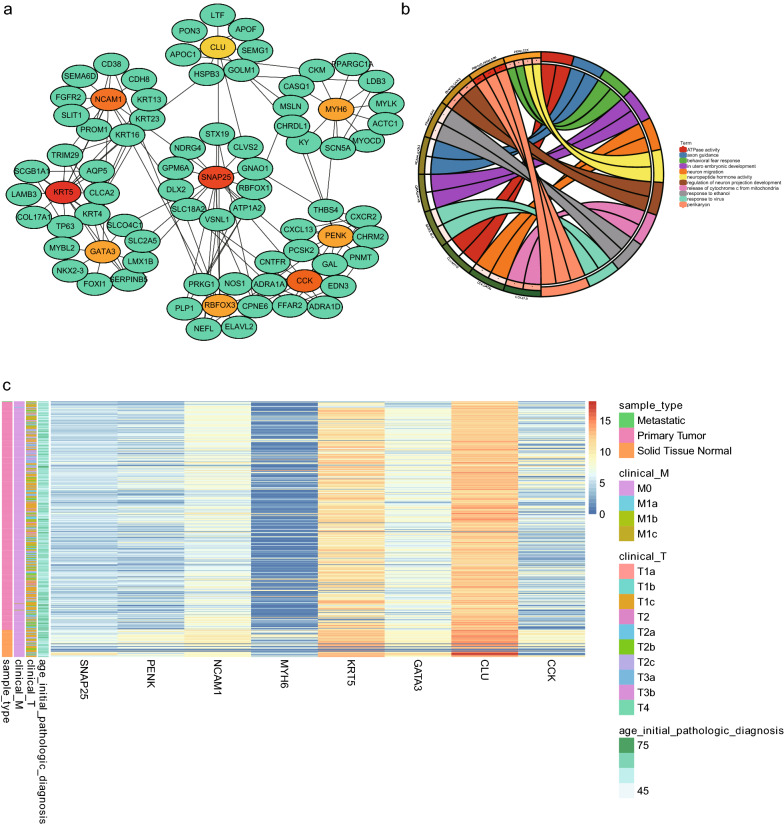
Interaction network and biological process analysis of hub DEGs. a Gene modules of hub DEGs. The color layout of the nine hub DEGs changed from yellow to red according to the cytoHubba plugin, indicating their increased importance. b GO enrichment analysis of hub DEGs. Enrichment analysis of hub genes was constructed. The number and names of hub genes involved in the gene ontology. p < 0.05 was considered statistically significant. c Heat map of hub DEGs. The color layout therein from blue to red indicates the expression levels of hub DEGs from down to up

