Fig. 2.
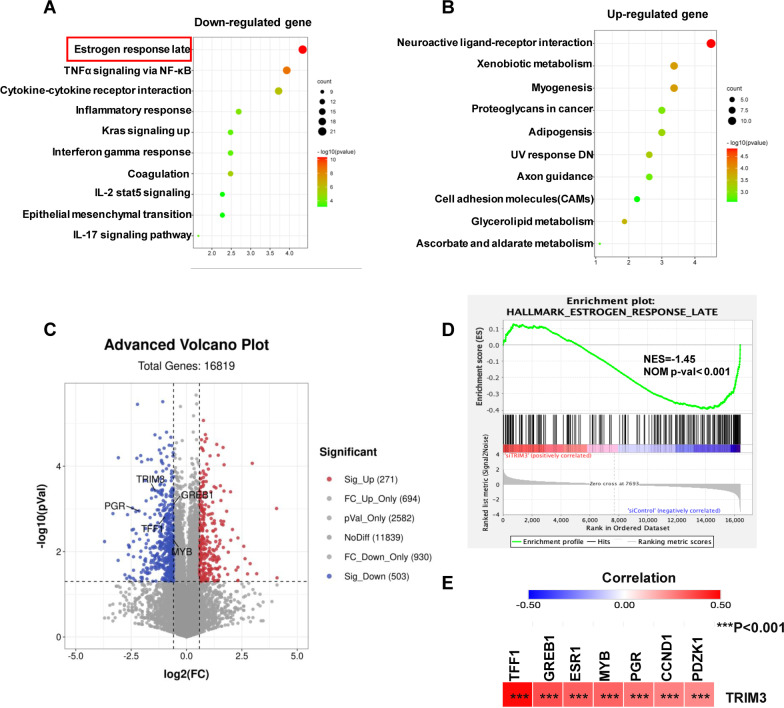
TRIM3 modulates estrogen signaling in breast cancer cells. a and b KEGG analysis of downregulated (left) and upregulated (right) genes in RNA-seq data of TRIM3 siRNA MCF-7 cells. c Volcano plot shows that canonical ER target genes are enriched in downregulated genes in TRIM3 siRNA MCF-7 cells. Threshold P < 0.01 and fold change > 2. d Gene set enrichment analysis (GSEA) shows enrichment of estrogen response genes in TRIM3 siRNA MCF-7 cells. e Heatmap of the correlation between TRIM3 and ER signaling target genes in breast invasive carcinoma (TCGA, PanCancer Atlas). Different colors represent correlation coefficients (in the diagram, red represents a positive correlation, blue represents a negative correlation), and darker colors represent stronger correlations. Asterisks represent levels of significance (***P < 0.001)

