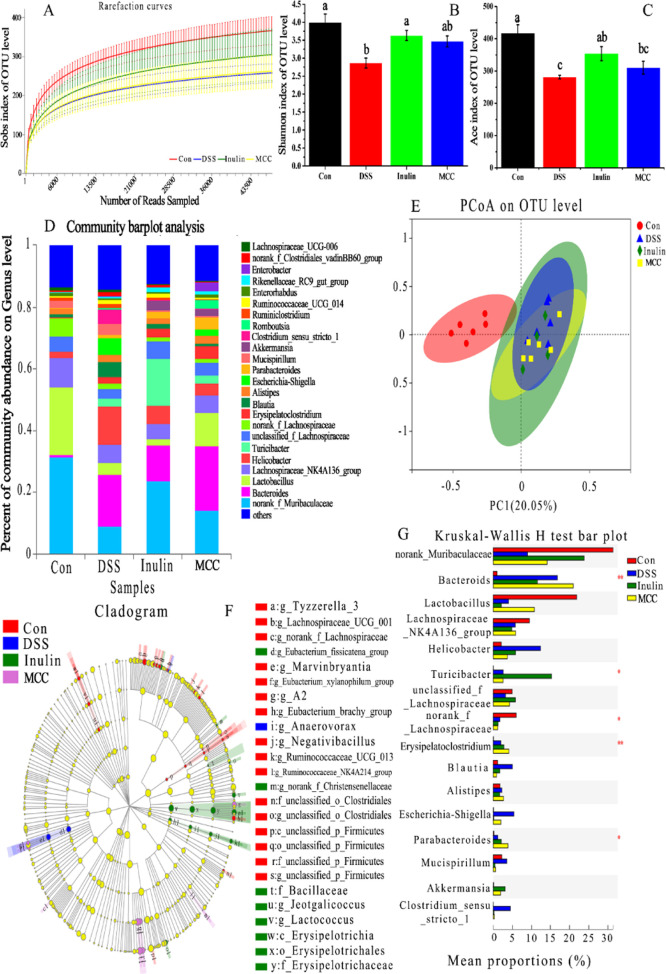
Figure 8.
DFs modulated the gut microbiota composition of mice with DSS-induced colitis. (A) Rarefaction curves of mice colon microbiota. (B) Shannon diversity index of bacterial communities in mice colon. (C) ACE diversity index of bacterial communities in mice colon. (D) Relative abundance of microbial genera among the four experimental groups. (E) PCoA of the gut microbiota communities based on OTU levels. (F) Differential abundance taxa of LEfSe cladogram analysis. (G) Relative abundance of the gut microbial community members. Different letters above the columns in panels B and C indicate significant differences (p < 0.05).

