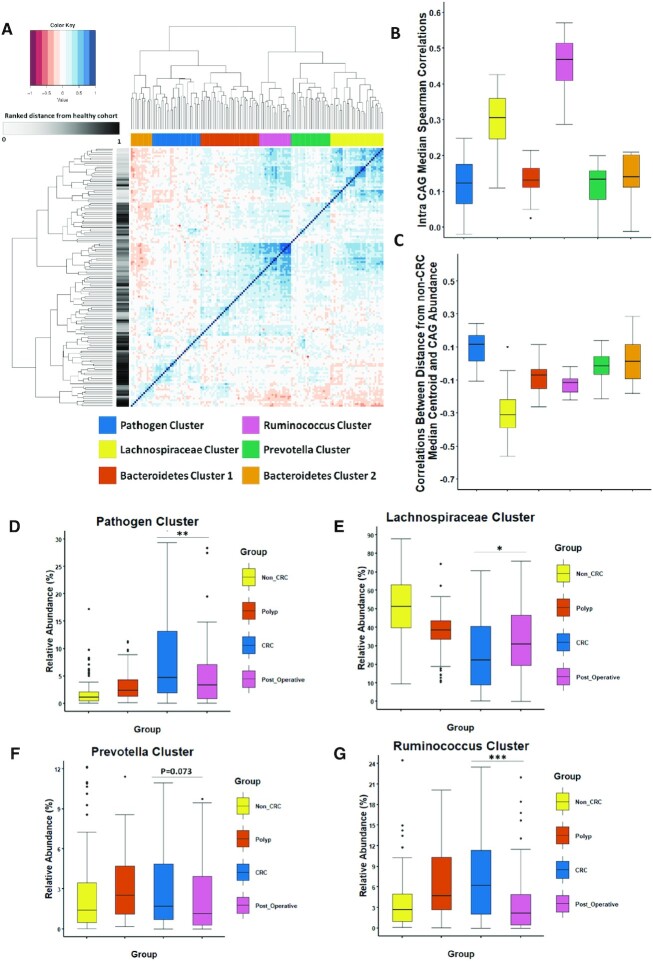
Figure 2.
Specific Co-Abundance Groups (CAGS) occur after removal of colonic cancer Six different co-abundance groups (CAGs) were identified through hierarchal clustering of Spearman correlations between genera abundances (full methodology described in Supplementary File S2). Patients after surgical resection have a significantly different CAG profile from other groups examined. (A) Heatmap showing the ward.d2 clustering of the spearman correlation coefficients of the relative abundance of genus in the mucosal microbiota of individuals in this study. Each different CAG identified is colour coded by the legend to the left. Row annotation refers to the distance of each sample from the non-CRC group. (B) Boxplot of the Intra Median CAG Spearman Correlations. C) Boxplot of the correlation between the distance from the non-CRC cohort and the CAG abundance. The relative abundance (%) of a number of CAGs was significantly different after surgical resection. Boxplots of four CAGs identified; (D) Pathogen cluster, (E) Lachnospiraceae cluster, (F) Prevotella cluster and (G) Ruminococcus cluster. Kruskal-Wallis followed by Dunns post-hoc test was used to determine significance. Not all significant pairwise comparisons are shown in this Figure. See Supplementary File S6 for complete statistics. The annotations used for P values are P < 0.05 *; P < 0.01 **; P < 0.001***.

