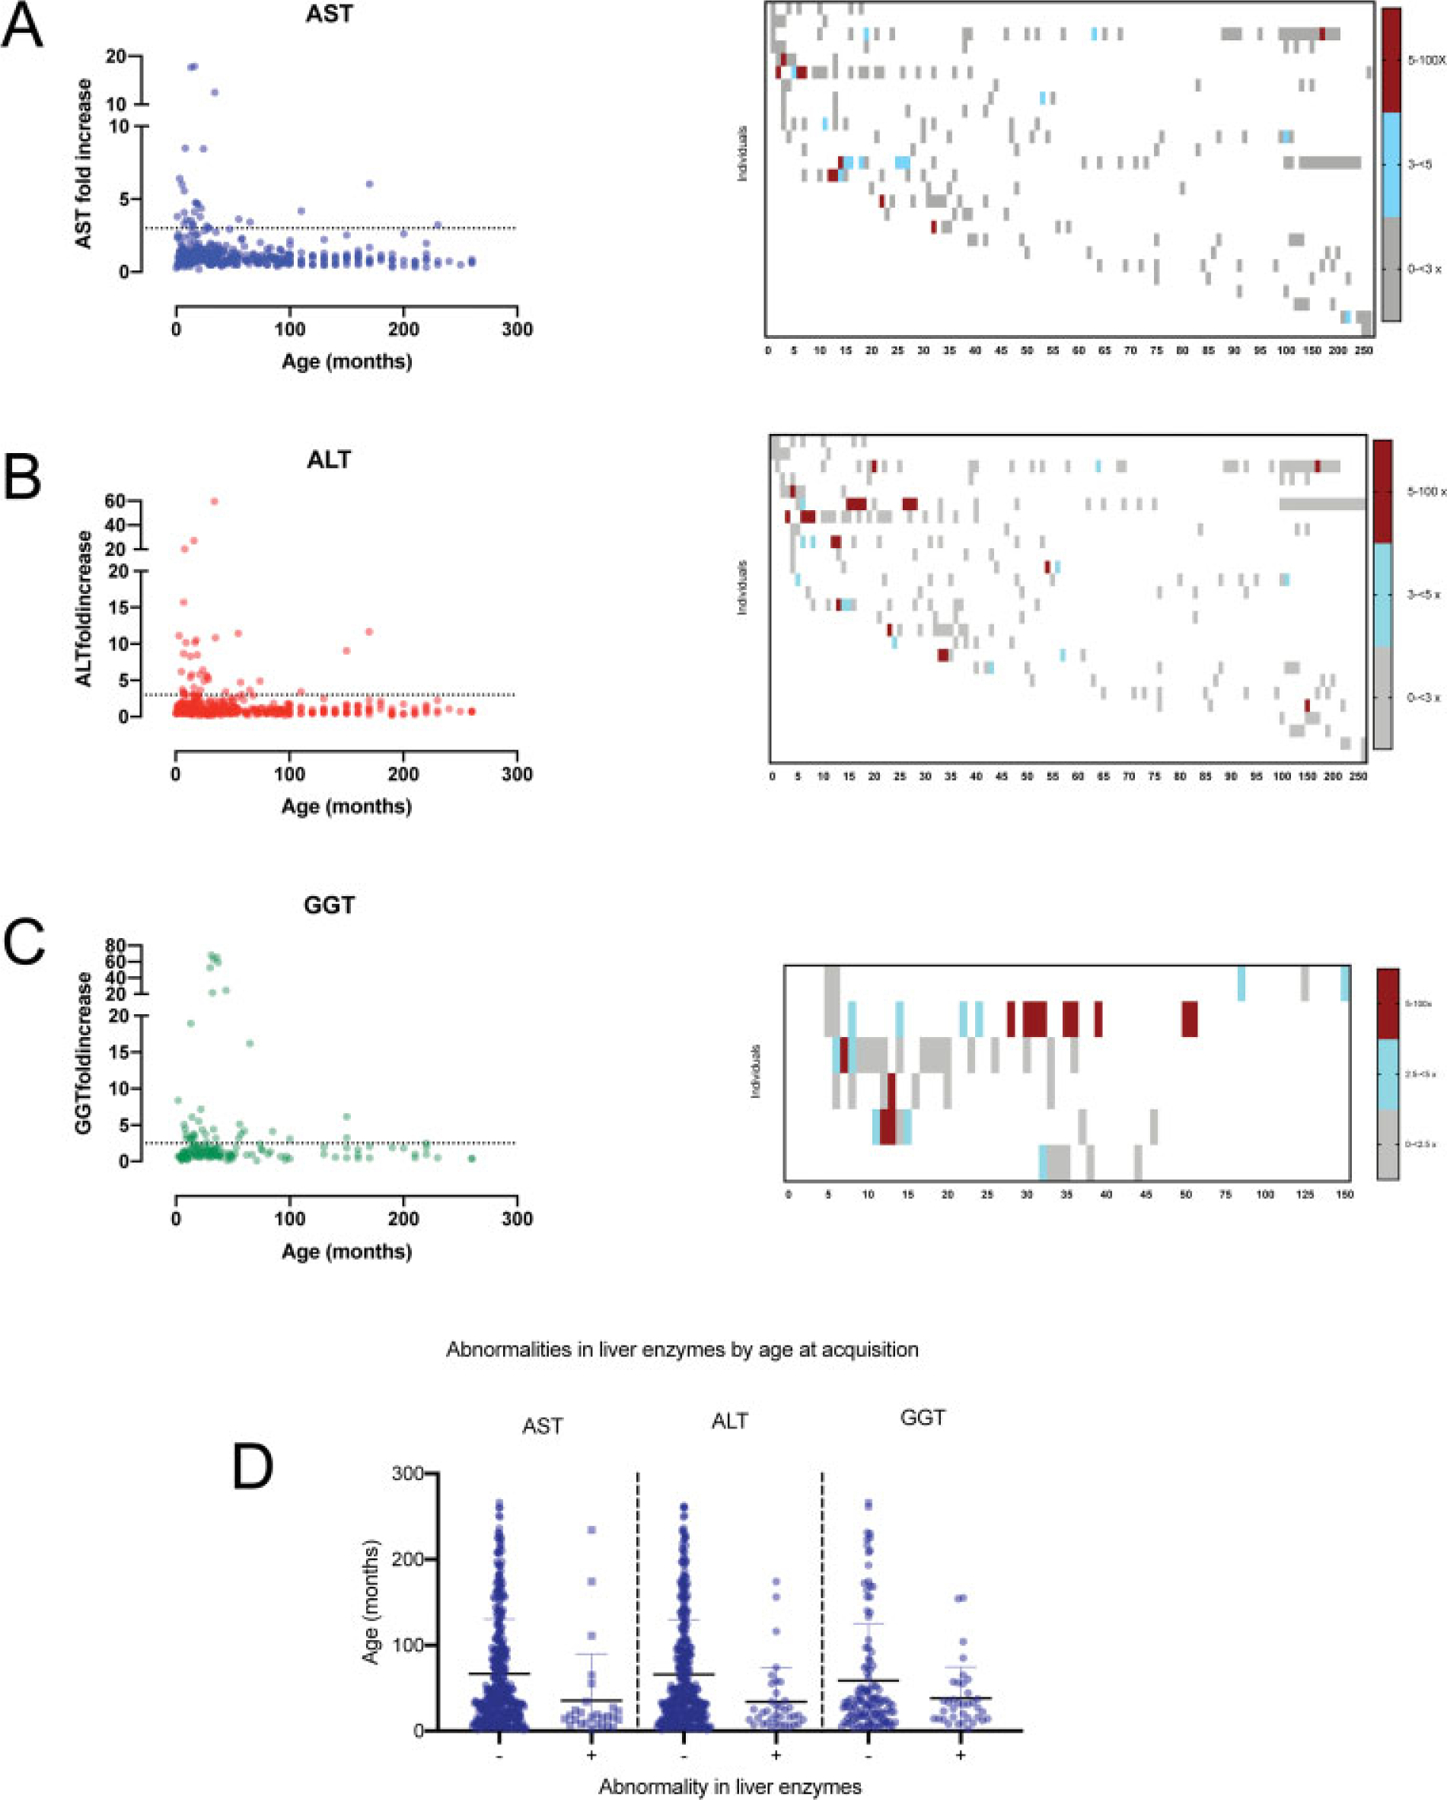
Fig. 2.

Serial measurements of liver enzymes (AST, ALT, and GGT) in the AGS cohort. In the left panels for A–C, the fold increase of each liver enzyme for each individual within a time period was compared to age at measurement for AST (A), ALT (B), and GGT (C). The maximal fold increase is shown for each month up to 100 months, and then 10 month increments afterward. In the right panels for A–C, heatmaps represent the sequential laboratory measurements for all individuals with 5 or more measurements (AST, n = 27, ALT, n = 27, GGT, n = 6). (D) The age at laboratory acquisition was compared between liver enzyme normal and abnormal values meeting criteria of hepatitis (QLS logistic regression, AST, p = 0.1603, ALT, p = 0.3375, GGT = 0.2808). ALT, alanine-aminotransferase; AST, aspartate-aminotransferase; GGT, gamma-glutamyl transferase; QLS, quasi-least squares.
