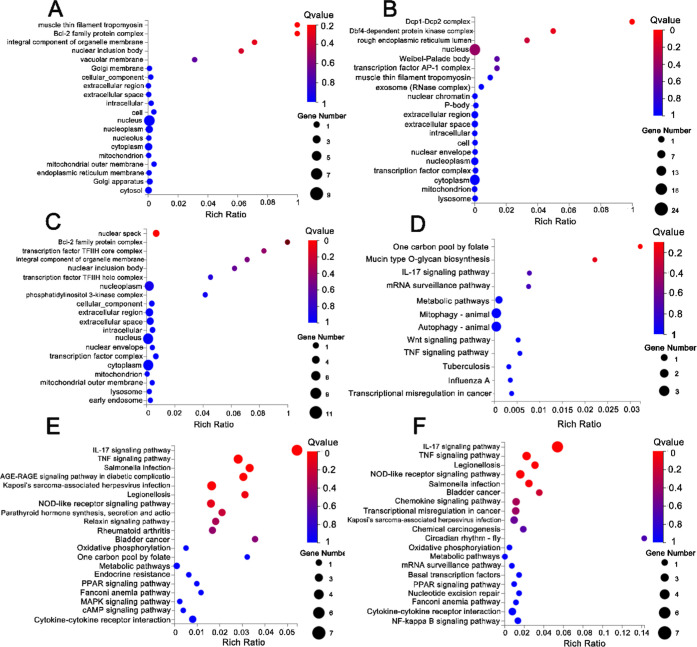
Figure 6.
GO and KEGG pathway analysis results. (A) GO analyses of DEGs in 1 nM F compared to UT, (B) GO analyses of DEGs in 1 nM G compared to UT, (C) GO analyses of DEGs in 1 nM G compared to 1 nM F, (D) KEGG enrichment analyses of DEGs in 1 nM F compared to UT, (E) KEGG enrichment analyses of DEGs in 1 nM G compared to UT, and (F) KEGG enrichment analyses of DEGs in 1 nM G compared to 1 nM F.

