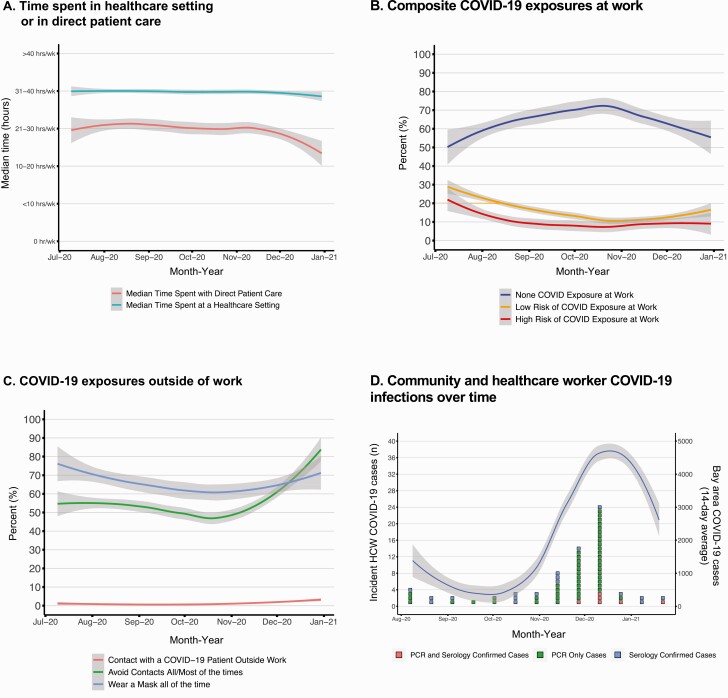
Figure 2.
Work and community-related coronavirus disease 2019 (COVID-19) exposures and incident cases among healthcare workers (HCWs) over time. A–C, Self-reported work and home exposures over time. Each line depicts the 7-day smoothed median responses of each self-reported home or community behavior or exposure. Gray shading represents 95% confidence intervals around the average. D, Incident cases in the context of surrounding community caseload. Boxes represent unique incident cases and are color coded by how they met case definitions, and the line represents the 14-day smoothed average of community-reported cases from the 6 San Francisco Bay Area Counties surrounding the 3 medical centers. Abbreviation: RT-PCR, reverse-transcription polymerase chain reaction.

