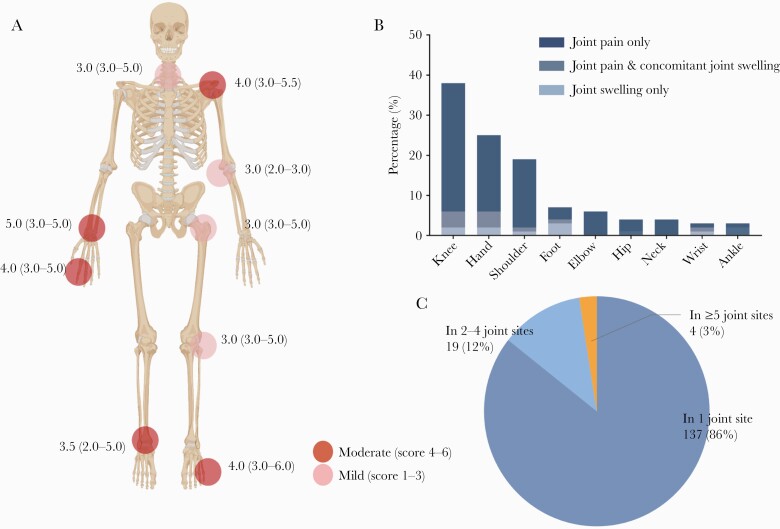
Figure 3.
Proportions and severity of rheumatic symptoms following coronavirus disease 2019 (COVID-19) at 12-month follow-up. A, Joint pain intensity. The darker the color, the higher the number of pain score of the pain sites. Data are median (interquartile range). B, Proportions of joint pain sites, joint swelling sites, and joint pain with concomitant joint swelling sites among COVID-19 patients. C, Proportions (number and %) of pain styles according to the number of joint groups involved.

