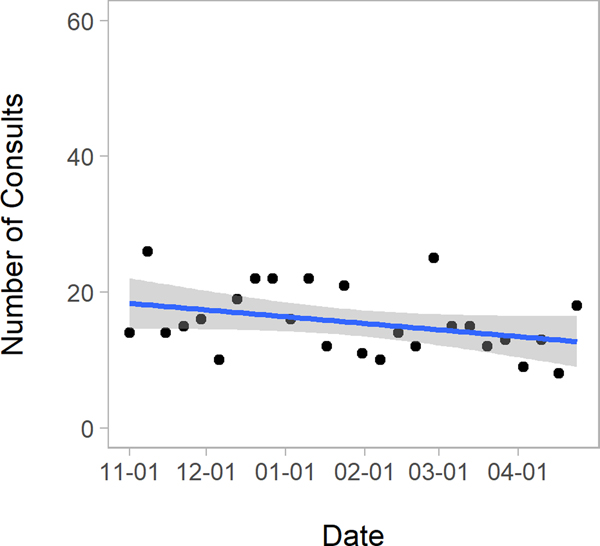
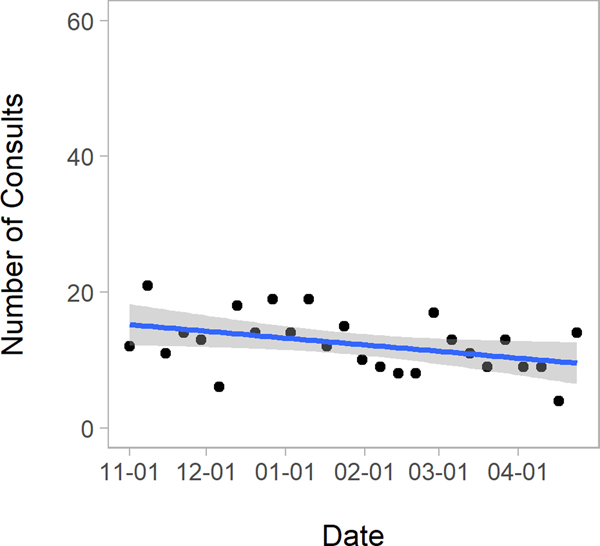
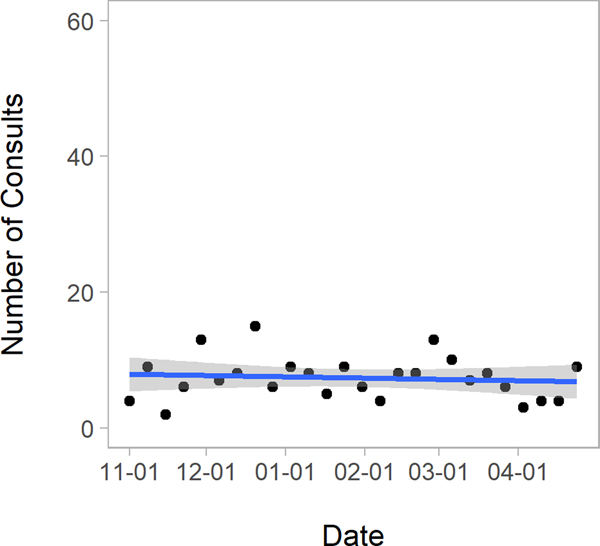
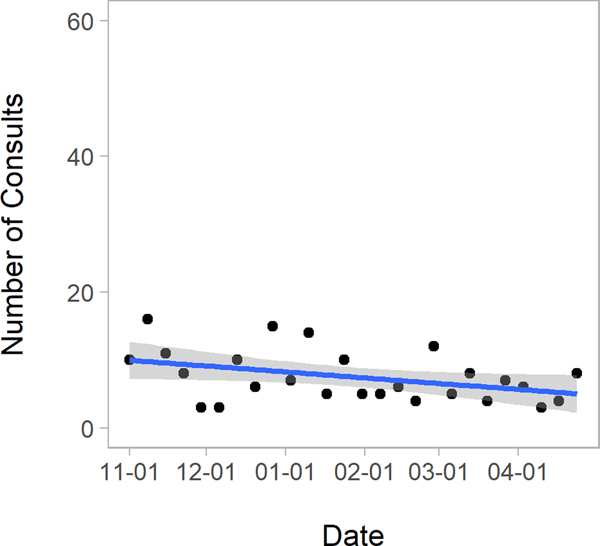
Figure 2. Trends in Comprehensive Stroke Center Patient Admissions: November 2019 – April 2020.
CSC Comprehensive Stroke Center.
Figures present scatterplots of the number of stroke patients during each week of the study period. The blue line gives the fitted regression line and the grey area denotes 95% confidence intervals.


