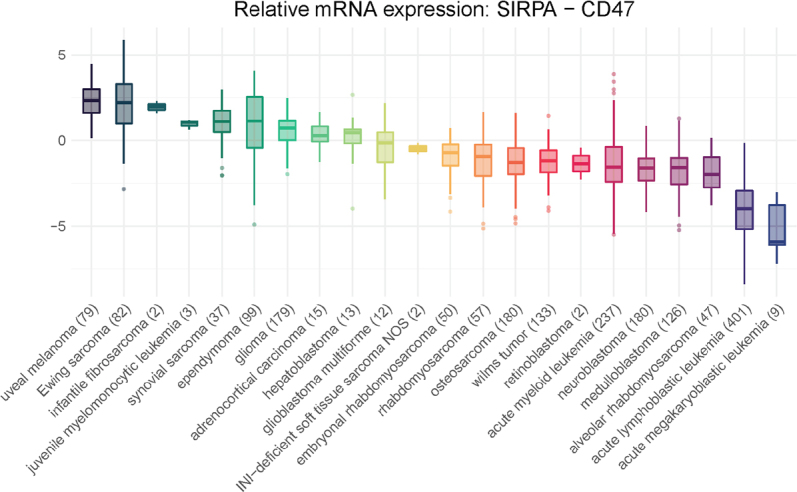
Figure 3.

SIRPα to CD47 relative mRNA expression. Included are the expression panels for pediatric cases as described in Figure 2. Y-axis in these two panels is the relative expression of SIRPα as compared to CD47 expression [i.e., log2(TPM + 1) expression of SIRPα - log2(TPM + 1) expression of CD47]. Positive value means expression of SIRPα is log2 fold change higher than CD47 expression and vice versa. Boxplots are ordered by their average relative expression. SIRPα: signal regulatory protein α
