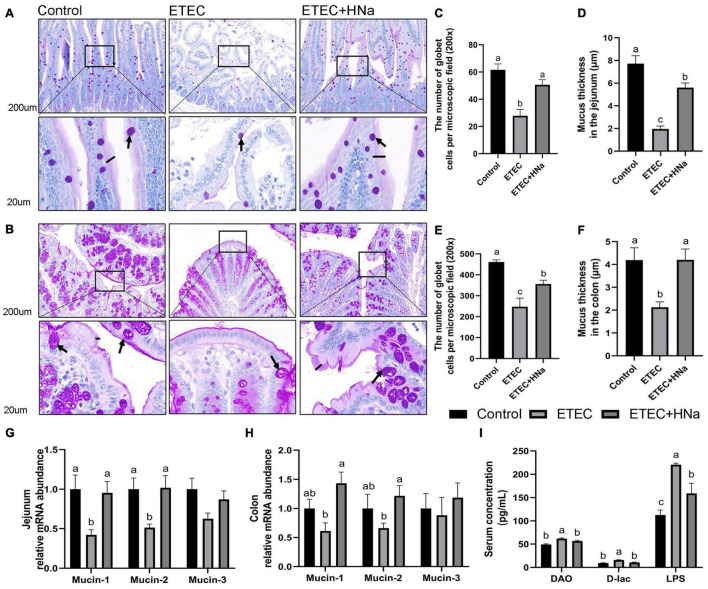
FIGURE 4.
Effects of sodium humate on the intestinal permeability in jejunum and colon of ETEC K88-infected mice. Representative images of the jejunum (A) and colon (B) stained with PAS (200 μm). Arrow points to goblet cell; black bars indicate mucus layer thickness. The number of goblet cells per microscopic field and the mucus layer thickness in the jejunum (C,D) and colon (E,F) of mice. The relative mRNA expression of mucin-1, mucin-2, and mucin-3 in the jejunum (G) and colon (H) of mice. (I) The concentrations of serum DAO, D-lac, and LPS. All of the data are expressed as the mean ± SEM. Different superscript lowercase letters within each group indicate significantly different (P < 0.05).

