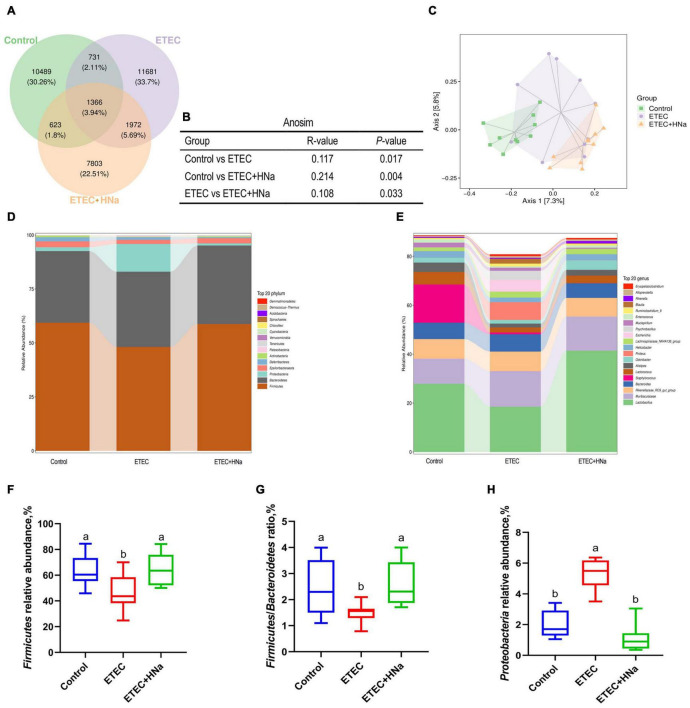
FIGURE 5.
Effects of sodium humate on intestinal microbiota composition of ETEC K88-infected mice. (A) A Venn diagram displayed the overlaps among groups (n = 10). (B) Anosim analysis among groups. (C) Principal co-ordinates analysis (PCoA) plot of intestinal microbiota; each represented by one color (n = 10). Community bar plots of phylum and genus level were shown in (D,E). (F) The relative abundance of Firmicutes. (G) The ratio of Firmicutes to Bacteroidetes. (H) The relative abundance of Proteobacteria. All of the data are expressed as the mean ± SEM. Different superscript lowercase letters within each group indicate significantly different values (P < 0.05).

