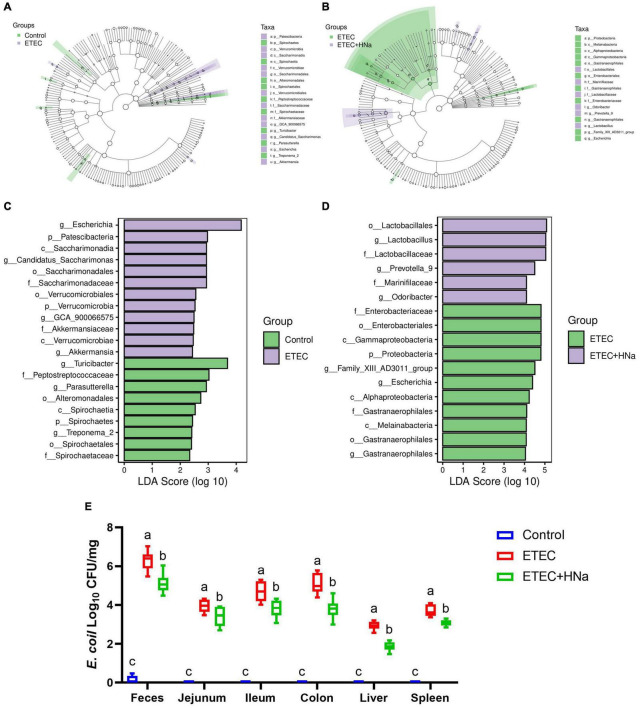
FIGURE 6.
Effect of sodium humate on the diversity of intestinal microbiota of ETEC K88-infected mice. Control vs ETEC (A) and ETEC vs ETEC + HNa (B) groups taxonomic cladogram of LEfSe analysis. Different colors indicate the enrichment of the biomarker taxa in different groups. The circle from inside to outside means the rank from kingdom to species, and the circle size represents the taxa abundance in the community. Control vs ETEC (C) and ETEC vs ETEC + HNa (D) linear discriminant analysis (LDA) scores for different taxa abundances. (E) The number of E. coli in jejunal mucosa, ileal mucosa, colonic mucosa, feces, liver, and spleen (n = 10). All of the data are expressed as the mean ± SEM. Different superscript lowercase letters within each group indicate significantly different (P < 0.05).

