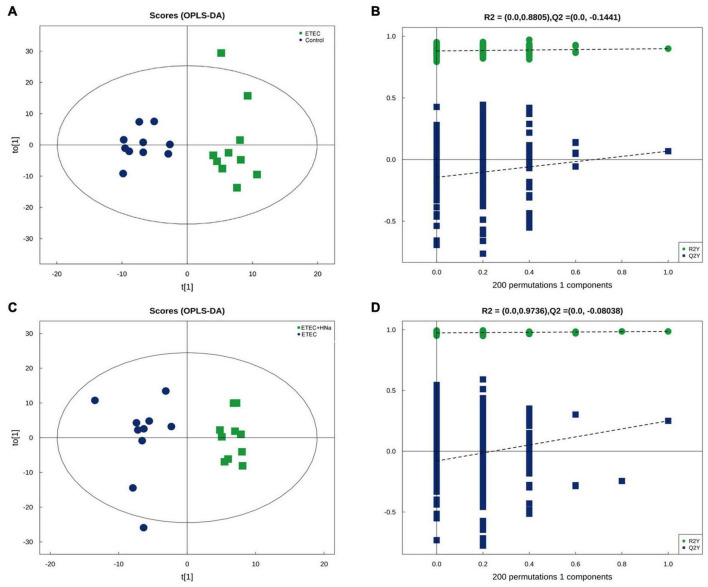
FIGURE 7.
Differentiation of the metabolic profiles using multivariate analysis. Orthotopic partial least-squares discriminant analysis (OPLS-DA) score plots from control vs ETEC (A,B) and ETEC vs ETEC + HNa (C,D) of fecal metabolites under negative ion mode. R2 and Q2 represent the interpretability and predictability of models. Enriched Kyoto Encyclopedia of Genes and Genomes (KEGG) pathway enrichment based on altered metabolites. The color of the point was P-value, and the redder, the more significant enrichment. The size of the spot represented the number of different metabolites enriched. Control vs ETEC group (E); ETEC + HNa vs ETEC group (F).

