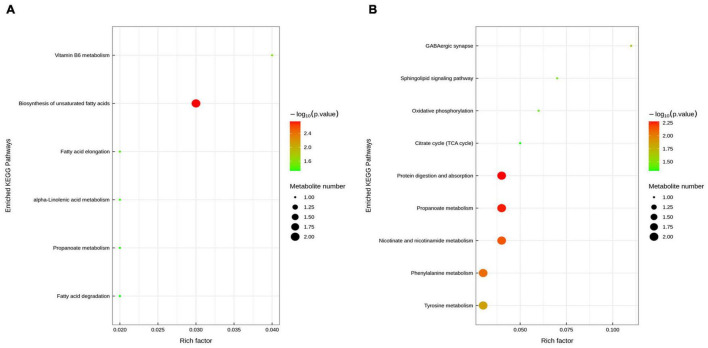
FIGURE 8.
Enriched Kyoto Encyclopedia of Genes and Genomes (KEGG) pathway enrichment based on altered metabolites. The color of the point was P-value, and the redder, the more significant enrichment. The size of the spot represented the number of different metabolites enriched. Control vs ETEC group (A); ETEC + HNa vs ETEC group (B).

