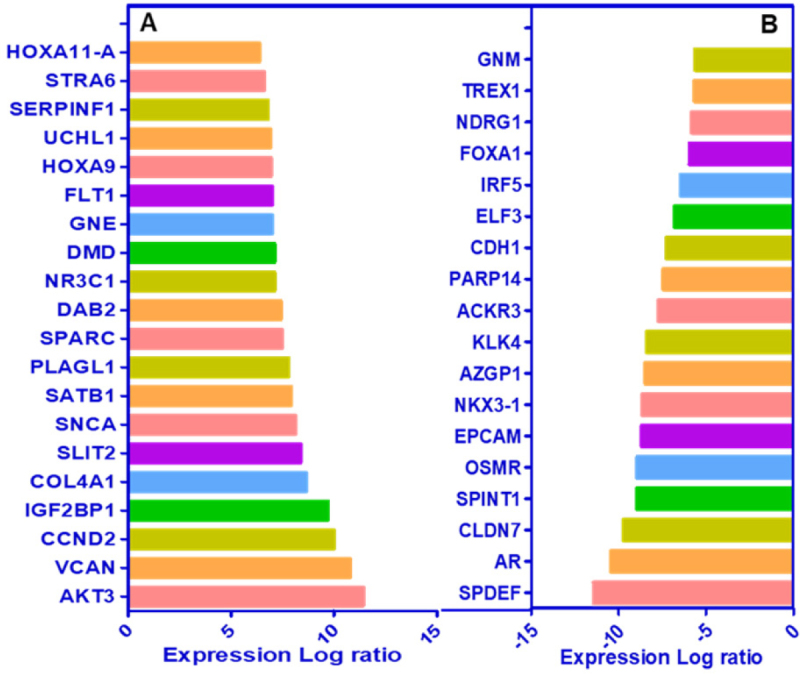
Figure 3.

Cascade of upstream and downstream transcriptional regulators. The NGS data of LNCaP-enzalutamide resistant cells identified (A) upstream and (B) downstream regulators, based on overlap p-values computed based on significant overlap between genes in the dataset and known targets regulated by the transcriptional regulator and represented in graph on scale of expression log ratio at overlap P-value ≤ 0.001. NGS: next generation sequencing
