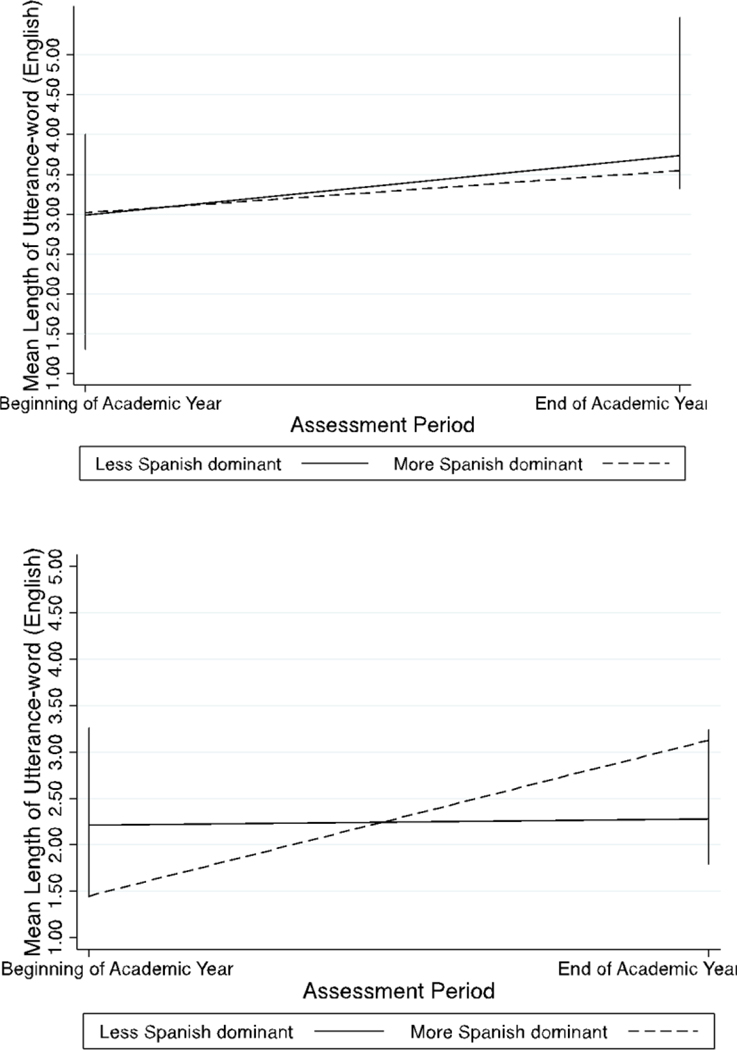
Figure 4.
Change in English mean length of utterance for less Spanish dominant and more Spanish dominant groups split by end-of-academic-year English mean length of utterance >3.31 (top) and English mean length of utterance <3.31 (bottom). More positive values along the y-axis index more English expressive proficiency. Assessment of language samples at the beginning and end of the academic year are categorically represented along the x-axis. Participants were medially split into ‘less Spanish dominant’ and ‘more Spanish dominant.’ Note. Vertical lines indicated range of values.

