Figure 3.
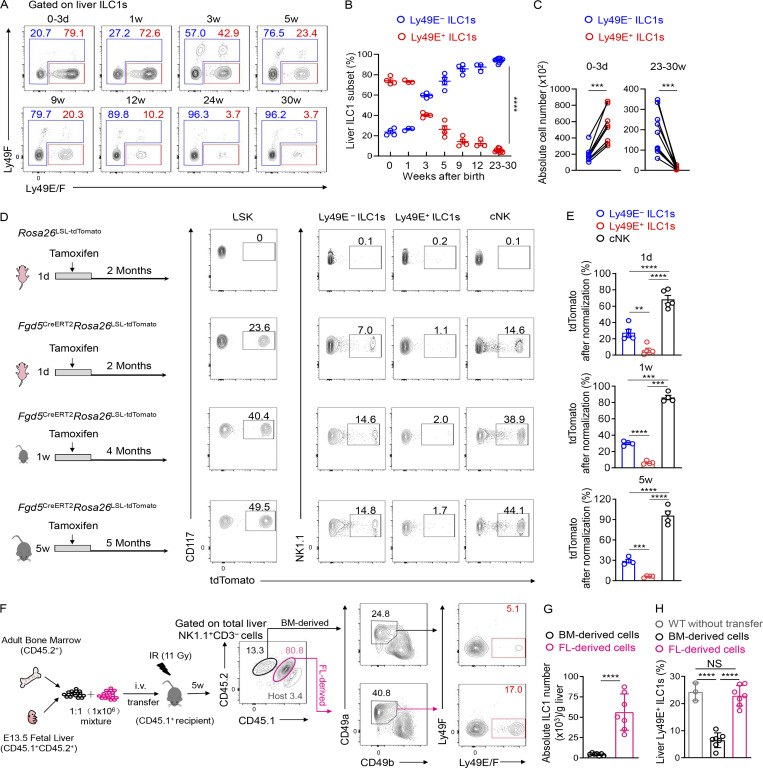
BM hematopoiesis contributes little to the Ly49E+ ILC1 pool. (A) Representative plots showing Ly49E expression on liver ILC1s from WT B6 mice at different ages. Data are representative of three independent experiments with n = 3–9 mice per condition. (B) Percentages of Ly49E+ or Ly49E− cells among liver ILC1s at different ages. Data for each time point are representative of three independent experiments with n = 3–9 mice. (C) Absolute cell numbers of ILC1 subsets per liver from WT B6 mice at ages 0–3 d or 23–30 wk. Data for 0–3 d are pooled from two independent experiments with n = 8 mice. Data for 23–30 wk are pooled from three independent experiments with n = 10 mice. (D and E) Fate-mapping analysis of neonatal (1 d and 1 wk) and adult (5 wk) Fgd5+ LSK cell–derived group 1 ILCs. Representative plots show tdTomato expression on BM LSK cells and liver group 1 ILC subsets from Fgd5CreERT2Rosa26tdTomato mice exposed to tamoxifen at different ages (D). Labeling efficiency of Ly49E− ILC1s, Ly49E+ ILC1s, and cNK cells normalized against LSK cells (E). Data are pooled from at least three independent experiments (1 d: n = 5; 1 wk: n = 4; 5 wk: n = 4). (F–H) Representative plots showing Ly49E expression on liver ILC1s from lethally irradiated recipient CD45.1+ mice that received the adoptive transfer of donor CD45.2+ BM (6–8 wk old) and CD45.1+CD45.2+ fetal liver (E13.5 fetal liver [FL]) MNCs (mixed at 1:1; F). Absolute cell numbers of donor BM- or FL-derived ILC1s in recipient livers (G). Percentages of donor BM- or FL-derived Ly49E+ cells among donor-derived ILC1s (H). Data are representative of at least two independent experiments with n = 3 or 7 mice per group. Bar graphs show the mean ± SEM; two-way ANOVA was used in B, paired Student’s t test in C, one-way ANOVA followed by Dunnett’s multiple comparison test in E and H, and unpaired Student’s t test in G; **, P < 0.01; ***, P < 0.001; ****, P < 0.0001.

