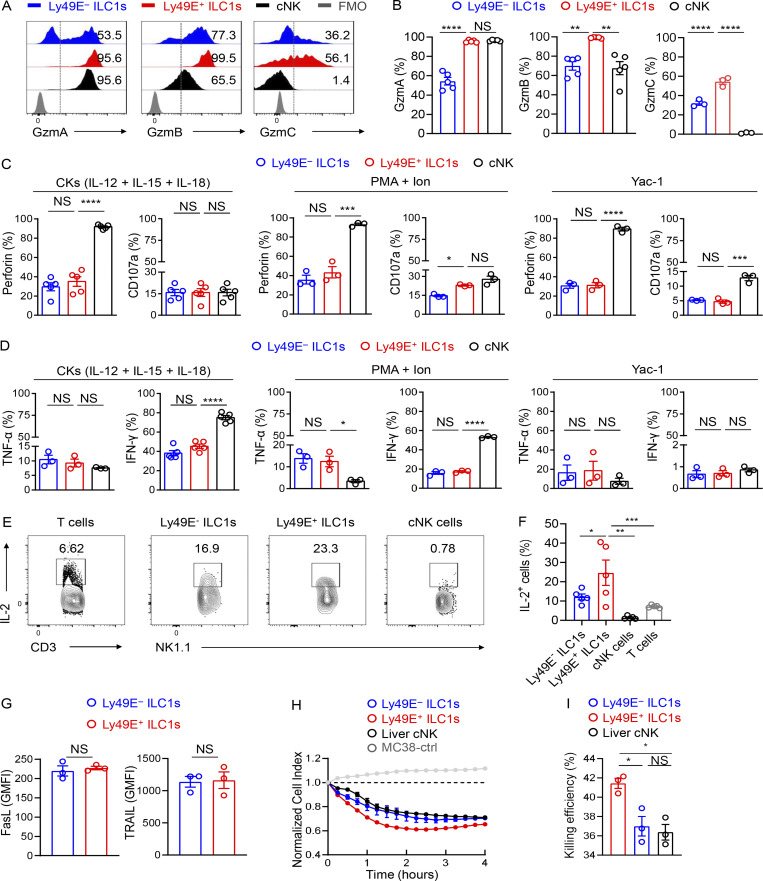
Figure S4.
Comparison of effector functions between Ly49E+ and Ly49E− ILC1s. (A and B) Representative histograms (A) and percentages (B) of cells expressing the indicated intracellular functional molecules (GzmA, GzmB, and GzmC) in liver group 1 ILC subsets of WT B6 mice (5–8 wk old) at steady state. Data are representative of two or three independent experiments with n = 3–5 mice per experiment. (C and D) Percentages of cells expressing perforin and CD107a (C) or TNF-α and IFN-γ (D) among liver group 1 ILC subsets of WT B6 mice (5–8 wk old) after stimulation for 18 h with 10 ng/ml IL-12, 10 ng/ml IL-15, and 50 ng/ml IL-18, 4 h with PMA plus ionomycin (PMA + Ion), or with Yac-1 cells. Data are representative of two or three independent experiments with n = 3 mice per experiment. (E and F) Representative plots (E) and percentages (F) of cells expressing IL-2 in liver T cells and group 1 ILC subsets of WT B6 mice (5–8 wk old) after stimulation for 4 h with PMA and Ion. Data are representative of two independent experiments with n = 5 mice per experiment. (G) GMFI of cells expressing FasL and TRAIL among Ly49E+ or Ly49E− ILC1s derived from WT B6 mice (5–8 wk old). Data are representative of two independent experiments with n = 3 mice per experiment. (H and I) Real-time cytotoxicity assays were performed using liver group 1 ILC subsets from WT B6 mice (3–6 wk old) as effector cells and MC38 tumor cells as the target cells, with an effector-target (E:T) ratio of 10:1. The cell index during 4 h (H) and percentages of killing efficiency at the 4-h time point (I) after incubation with effector cell. Data are representative of two independent experiments with n = 3 samples per group. Bar graphs show the mean ± SEM; one-way ANOVA followed by Dunnett’s multiple comparison test was used in B–D, F and I, and unpaired Student’s t test in G; *, P < 0.05; **, P < 0.01; ***, P < 0.001; ****, P < 0.0001.

