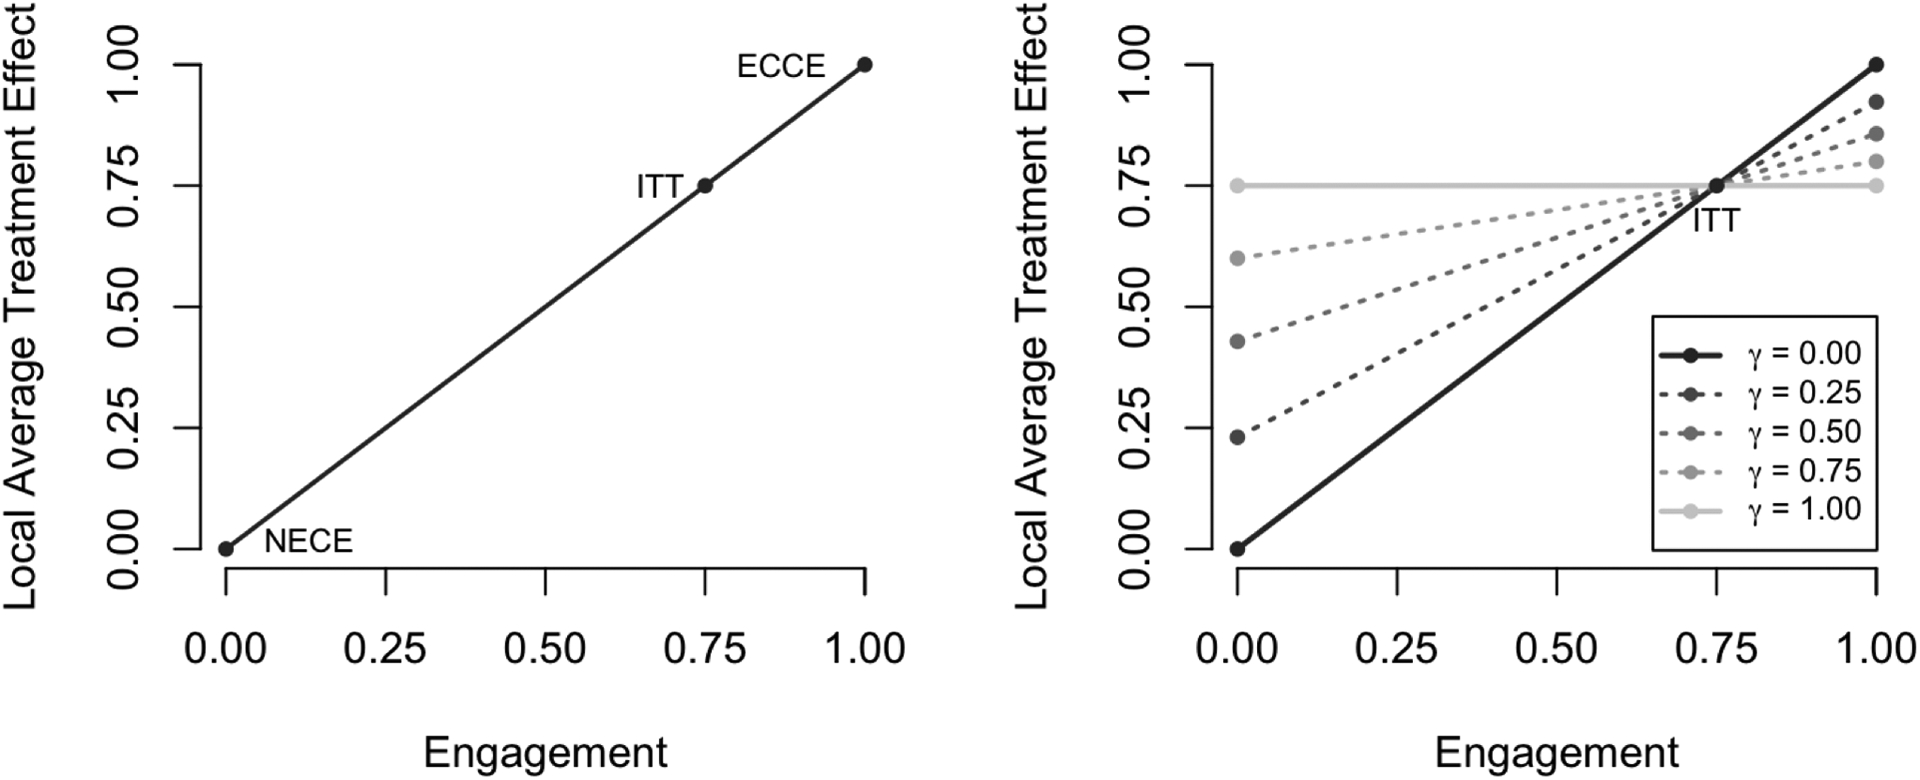
Fig 2.

Illustration of treatment effect bounds in a simple setting. On the left, we highlight how the treatment effect would be characterized across different levels of engagement by a traditional IV analysis (γ =0). The presumed NECE, ECCE, and ITT are all shown in this case. On the right, we show how the treatment effect is characterized across different levels of engagement under various sensitivity parameters. Note at each level of engagement, the treatment is bounded by the ITT and a specified multiple thereof (solid lines); also depicted are the results for nontrivial values of γ (dotted lines).
