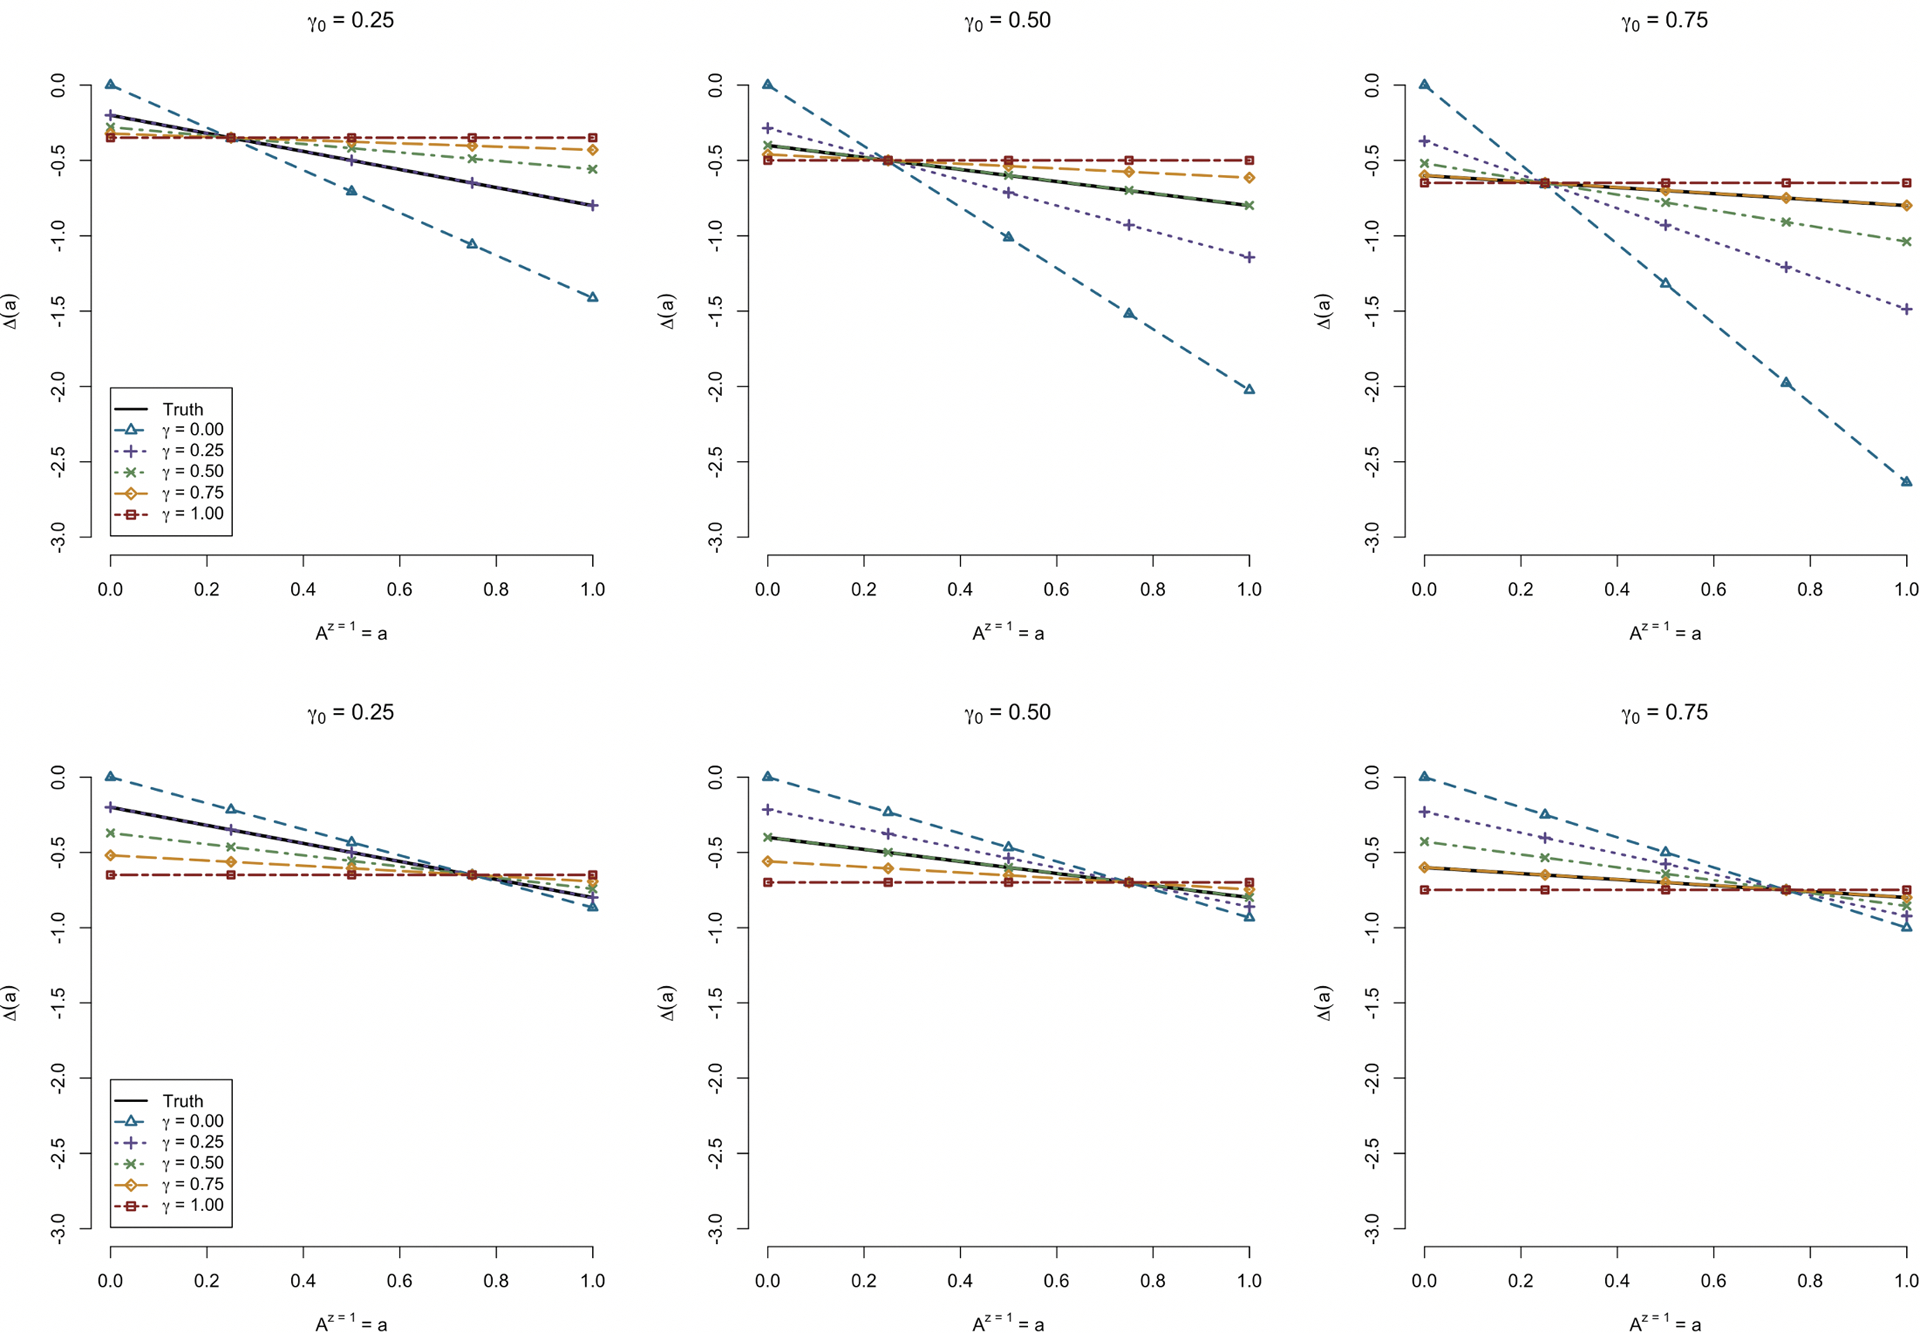
Fig 4.

Simulation study results across different values of γ (possibly misspecified) under γ0 =0 (left), γ0 =0.50 (center), and γ0 = 1 (right). Plotted are the average point estimates across different levels of a for various selections of γ. The upper panels depict the situation in which the mean level of engagement is lower; the upper panels depict the situation in which the mean level of engagement is higher
