
Fig 7.
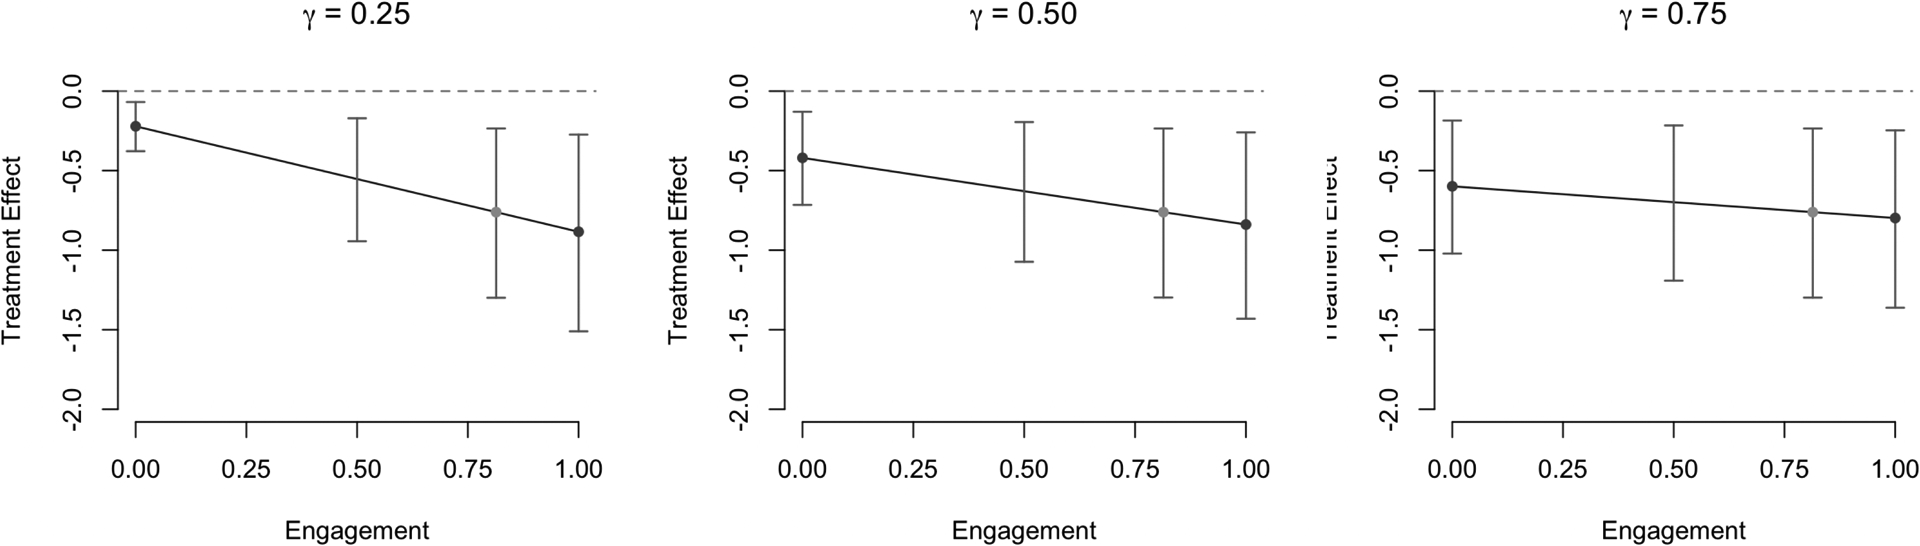
Local average treatment effects and corresponding confidence intervals across levels of Az=1 = a for three different values of the sensitivity parameter, γ. Also depicted in each plot are the estimated NECE and ECCE (dark gray points) and ITT (light gray point), and quantile-based bootstrap 95% confidence intervals for local average treatment effects at specified levels of a.