
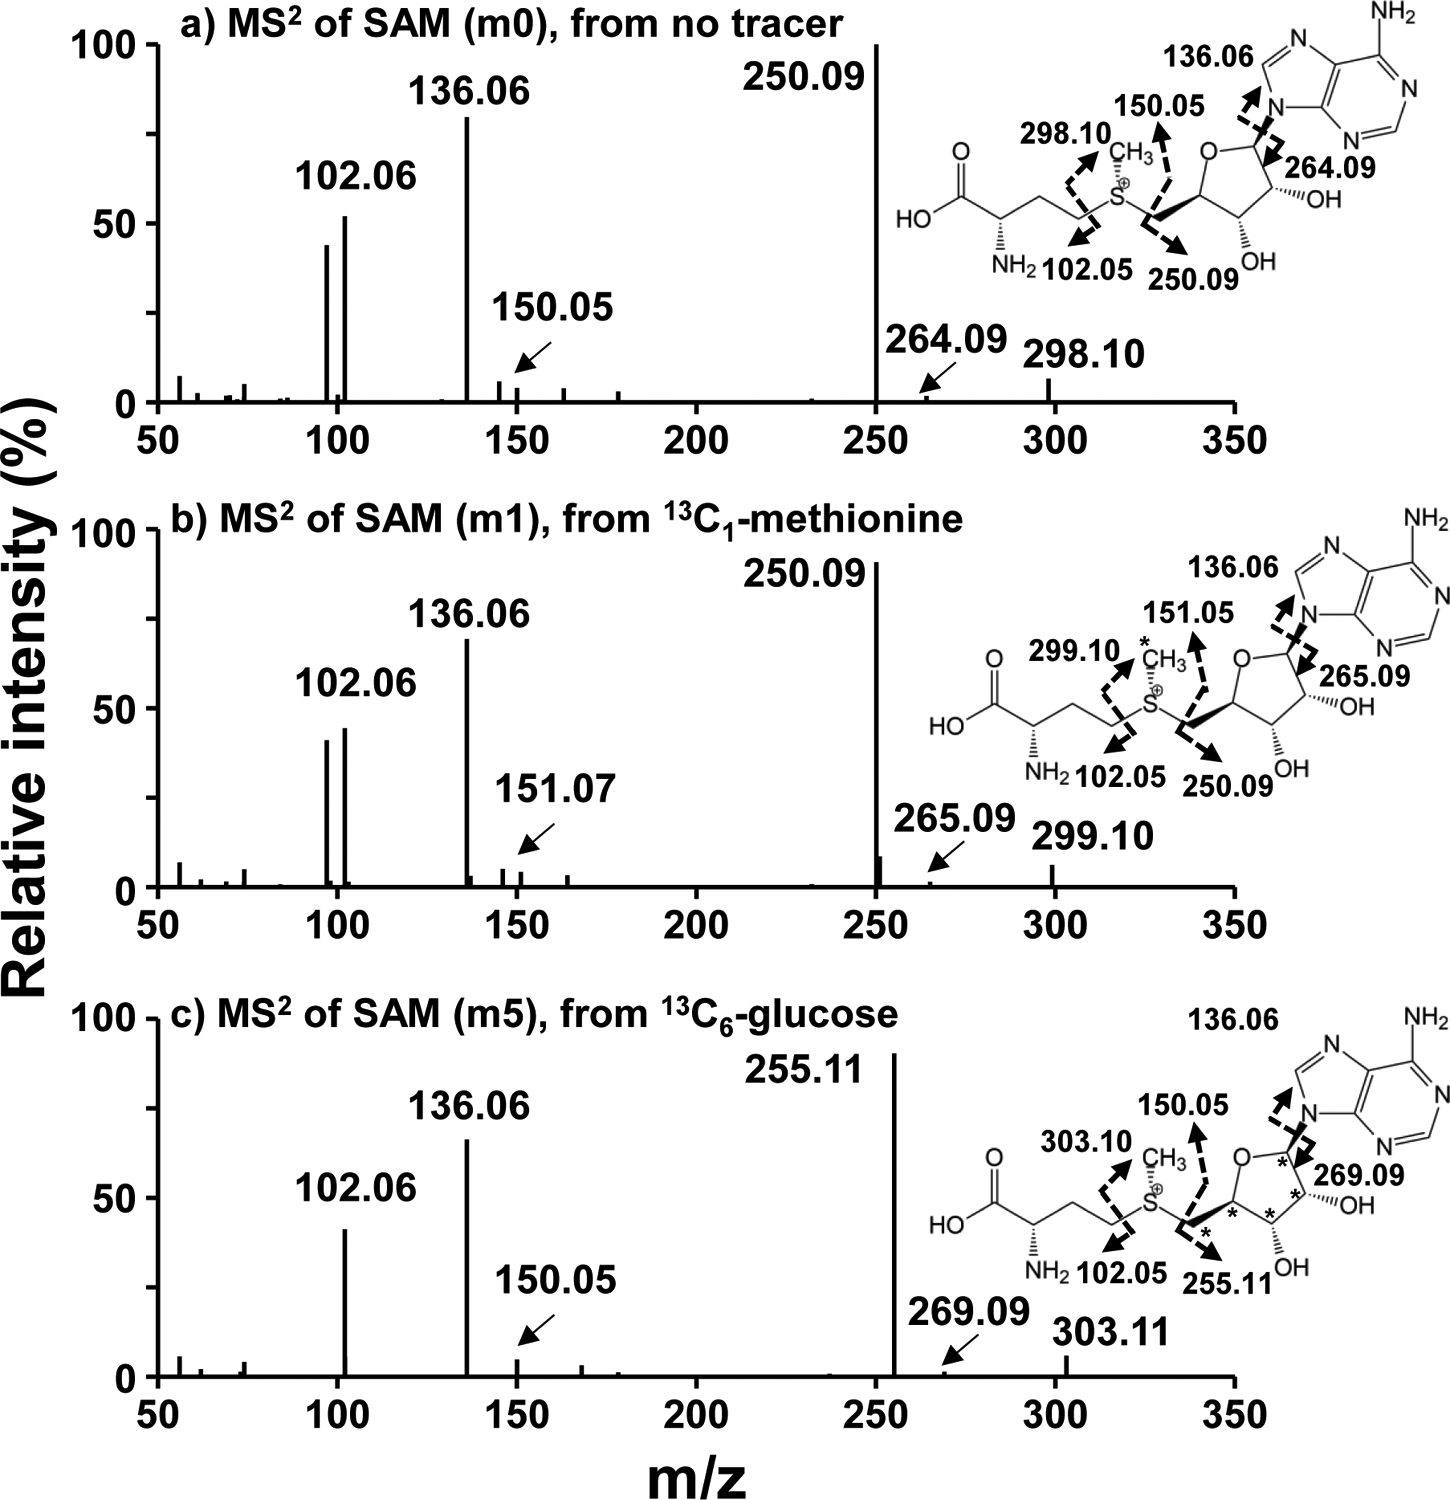
Figure 6. MS/MS spectra of SAM from A549 cells exposed to 13C6-glucose or 13C1-CH3- methionine.
Cells were grown as described for Figure 5.
- MS/MS of m0 isotopologue of SAM (399.1443 m/z) from an unlabeled sample
- MS/MS of m1 isotopologue of SAM (400.1479 m/z) from a 13C1-methionine labeled A549 cell extract,
- MS/MS of m5 isotopologue of SAM (404.1613 m/z) from a 13C6-glucose labeled A549 cell extract.
Data were acquired at a setting of 500 K mass resolution with 10 μscan/scan. Asterisks(*) represent 13C.
Dashed arrows represent the fragmentation positions giving rise to the observed m/z.