
Figure 7. Cell line-dependent perturbations of SAM/SAH levels and ratios by MSA, selenite, and SeM treatments.
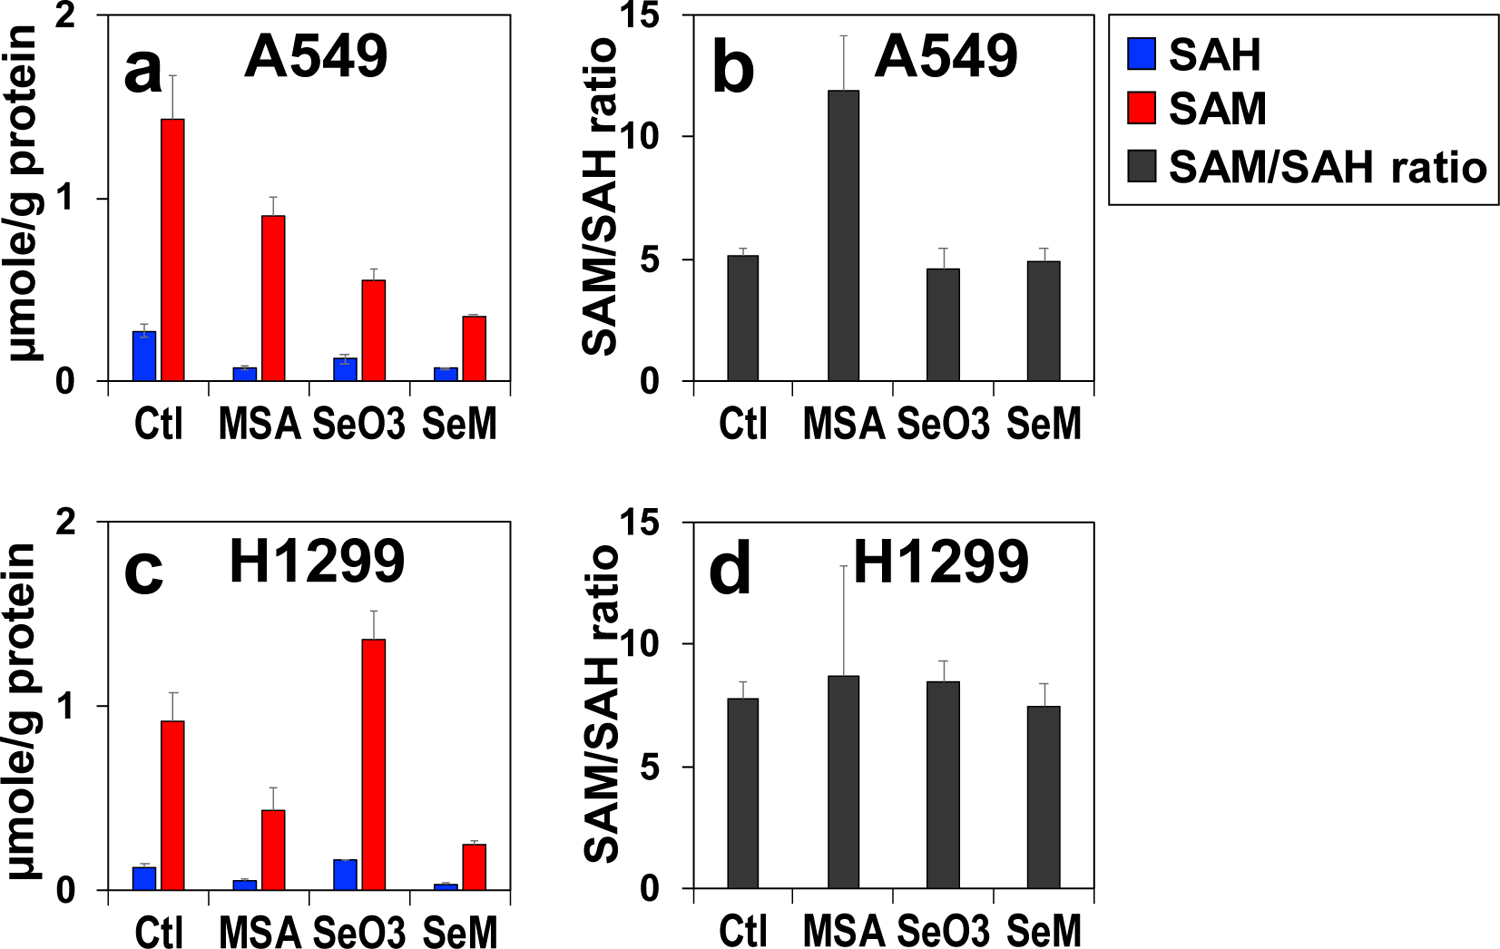
A549 (a,b) and H1299 (a,b) cells were treated with 5 μM MSA, 6.25 μM selenite, or 0.5 mM SeM for 24 h (n = 3), extracted for polar metabolites, and analyzed for SAM/SAH as described in Experimental. ■: SAH; ■: SAM; ■: SAM/SAH ratio.