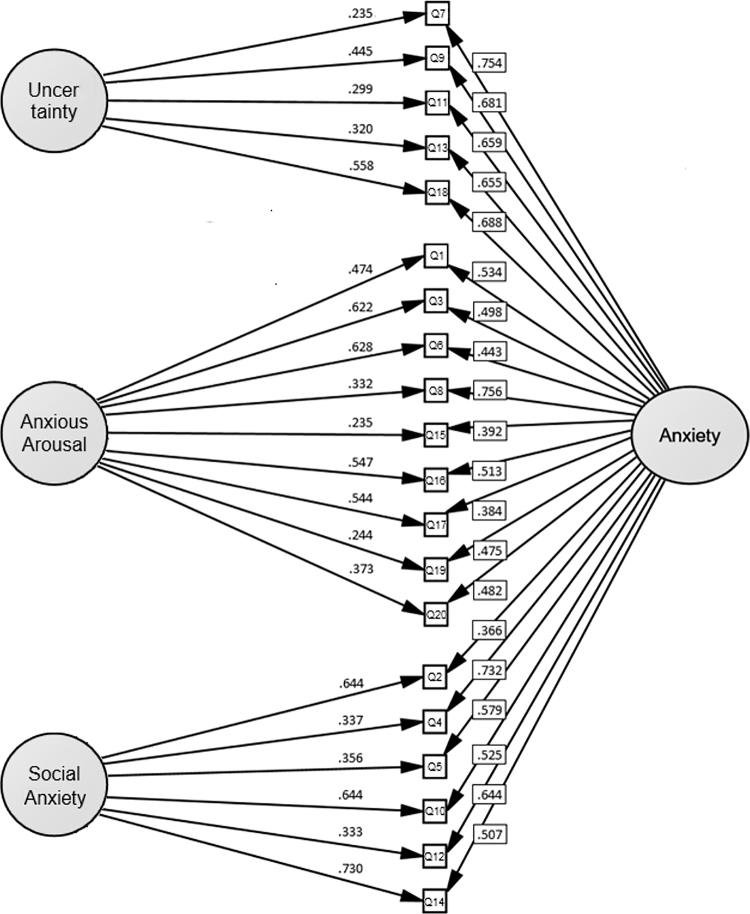
FIG. 1.
Bifactor model of the ASA-A. Ellipses represent latent variables, and rectangles represent measured variables; errors are not shown in the diagram but were specified for each variable. Error covariances between Q5–12 ( = 0.487) and Q15–19 ( = 0.312) on the Anxious Arousal group factor and Q8–16 ( = 0.452) on the Social Anxiety group factor are not shown, but were included in the analysis. ASA-A, Anxiety Scale for Autism-Adults.

