
FIGURE 3.
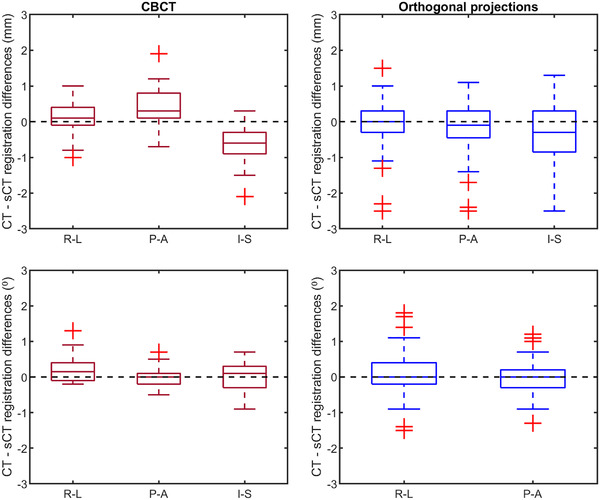
Differences in translation (upper row) and rotation around the specified axis (lower row) between deformed computed tomography (dCT) and synthetic CT (sCT). The red boxplots (left column) show differences in translation and rotation between cone beam CT registered to dCT, and CBCT registered to sCT for 14 cases in the right‐left (R‐L)/pitch, posterior‐anterior (P‐A)/yaw and inferior‐superior (I‐S)/roll directions. The blue boxplots (right column) show differences in translation and rotation between deformed DRR registered to orthogonal and synthetic DRR registered to orthogonal projection for 14 cases and six observers. The bar of the boxplots is the inter‐quartile range (IQR), the whiskers 1.5IQR and the plus outliers > or < 1.5IQR.